


Most ecommerce brands have the same instinct when email performance drops: look at the open rate, feel concerned, adjust the subject line, repeat. That loop is one of the main reasons email programs stagnate – the numbers being watched are not the ones connected to actual business outcomes.
This article is a working reference for benchmarks that actually matter in 2026: flow conversion rates, deliverability thresholds, campaign placed order rates, repeat purchase rate by category, and list growth quality signals. Where benchmarks are useful, we explain what drives them. Where they mislead, we say so plainly.
A note on how to use this data: benchmarks are context-dependent. The numbers that define strong performance for a supplement brand operating on a 30-day repurchase cycle are structurally different from what matters for a furniture brand. Read every figure with its category context in mind.
Key takeaways
- Open rate is not a performance benchmark. Apple Mail Privacy Protection (MPP) has permanently distorted open tracking, and even without that, open rate tells you nothing about whether your email program drives revenue.
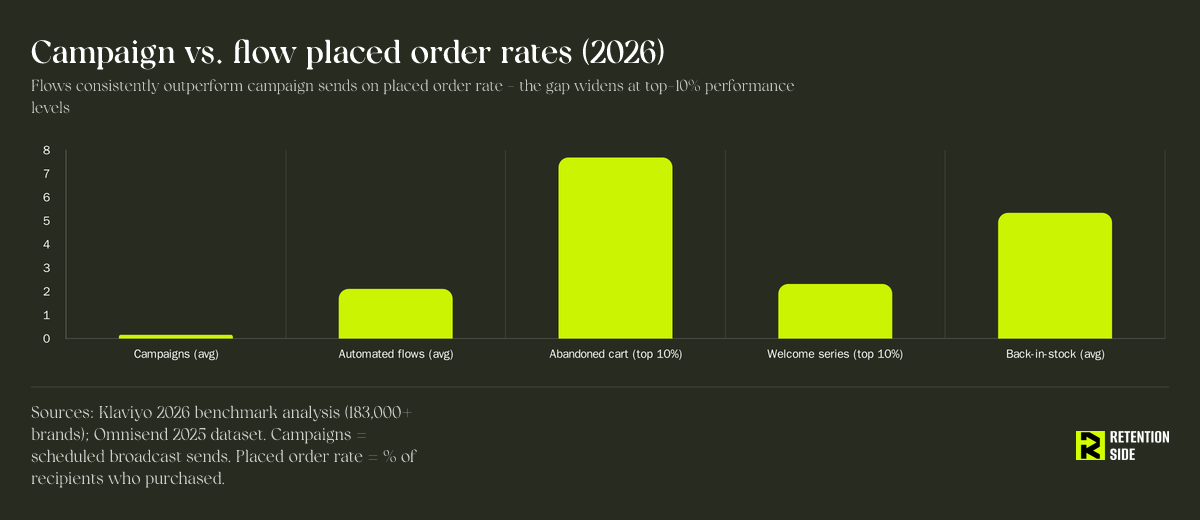
- Automated flows convert at dramatically higher rates than campaigns – not because campaigns don’t matter, but because flows arrive at moments of active purchase intent. Both are essential to a full program.
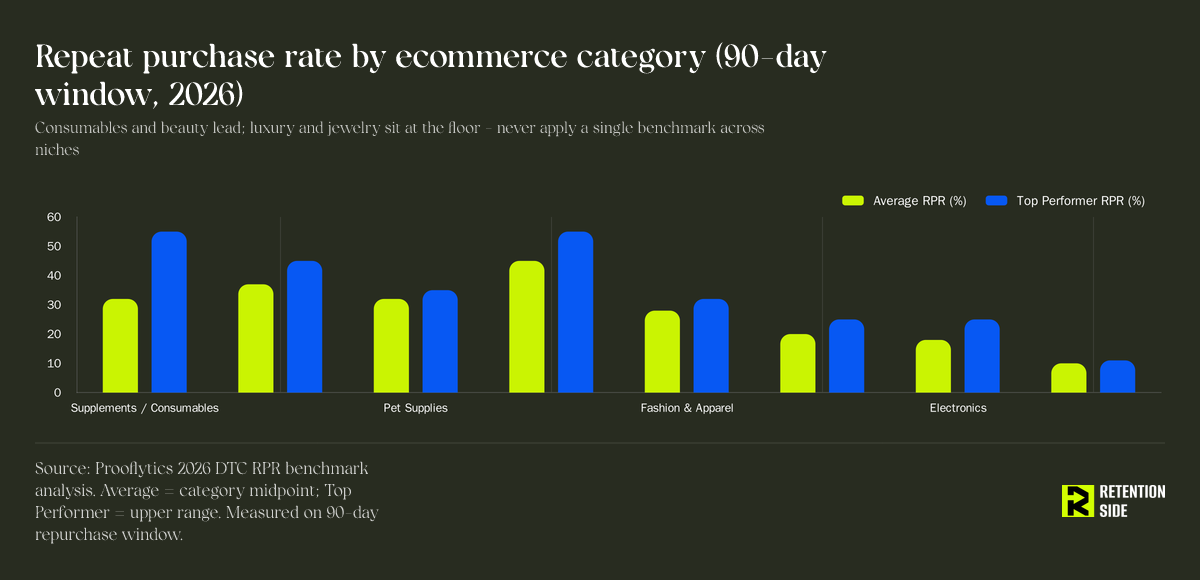
- Repeat purchase rate varies by a factor of five across ecommerce categories. A 22% RPR in fashion is reasonable. A 22% RPR in supplements is a serious retention problem. Never apply a single benchmark across niches.
- The deliverability thresholds set by Gmail and Yahoo in recent years are now hard requirements, not best practices. Spam complaint rate above 0.3%, missing authentication, and sending to unengaged lists are active liabilities.
- The metrics that tell you whether your email program is working are: repeat customer rate, revenue attributed to owned channels, list growth quality (lead-to-customer rate), deliverability indicators, and flow-level conversion. Not open rate. Not revenue per recipient.
What we’ll cover
- Why most email benchmarks mislead ecommerce operators
- The deliverability floor: thresholds that determine whether anything else matters
- Campaign benchmarks by ecommerce category
- Automated flow benchmarks: conversion rates, placed order rates, and what they mean
- Repeat purchase rate benchmarks by niche (the metric that actually captures retention)
- List growth quality: what good looks like beyond subscriber count
- How to diagnose underperformance without optimizing the wrong thing
Why most email benchmarks mislead ecommerce operators
The benchmarks most widely circulated in email marketing – open rates by industry, average click-through rates, revenue per recipient – share a structural problem: they measure intermediate actions, not business outcomes. They’re also heavily influenced by factors outside your email program, which makes them unreliable as performance targets.
Open rate is the clearest example. Since Apple Mail Privacy Protection launched in late 2021, inbox providers preload tracking pixels through proxy servers. An email counts as “opened” before a subscriber ever looks at it. Litmus research on Apple MPP documents how the feature distorts open tracking across the entire subscriber base, and Twilio’s analysis of iOS 18 and MPP estimates that Apple Mail now accounts for a significant portion of all consumer email opens in the US. Industry estimates put the inflation of recorded open rates at 35-68% for Apple Mail users, which means a meaningful share of reported opens across any given list are machine-generated. Year-over-year open rate comparisons have been largely meaningless since that shift. Category benchmarks for open rate are still published widely – and still quoted in agency reports – but they describe a distorted signal.
There is one scenario where open rate still serves a diagnostic purpose: if your open rate is consistently and unexpectedly low, it often reflects a deliverability issue rather than a subject line problem. The signal is useful as a red flag, not as a KPI to optimize toward.
Revenue per recipient has a similar problem. Some emails are designed to educate. Some are designed to collect zero-party data. Some strengthen the relationship before a sale. Judging every email by revenue per recipient mischaracterizes what a functional email program is supposed to do and leads to cutting the emails that build long-term retention in favor of short-term promotional sends that train your list to wait for discounts.
The benchmarks worth tracking are the ones that connect to customer behavior and business growth: placed order rate (the percentage of recipients who actually complete a purchase), conversion rate by flow type, repeat customer rate over time, and deliverability indicators that tell you whether your emails are even reaching inboxes. The sections below cover each of these.
The deliverability floor: thresholds that determine whether anything else matters
Before any benchmark for campaign performance or flow conversion is relevant, one question has to be answered: are your emails actually reaching inboxes?
Deliverability is not the same as delivery. An email can be “delivered” in the technical sense – accepted by the receiving mail server, not bounced – while simultaneously being routed to spam or filtered entirely. A 99% delivery rate says nothing about inbox placement. You can have a 99% delivery rate and 40% of your sends going to spam, which means a significant portion of your list never sees the emails you send them. This distinction – and its revenue impact – is covered in depth in our guide to email deliverability in 2026.
Inbox placement rate is the metric that captures this. It measures the percentage of sent emails that land in the primary inbox rather than the spam folder or other tabs. It is the foundational metric for the channel, because every downstream number – conversion rate, repeat purchase rate, revenue from email – is a function of how many people actually receive what you send.
The hard requirements as of 2026:
All major inbox providers (Gmail, Yahoo, Outlook) have formalized sender requirements for bulk senders. These are no longer best practices – they are hard thresholds. Gmail’s official sender guidelines and Yahoo’s bulk sender best practices both publish these requirements explicitly:
- Email authentication (SPF, DKIM, DMARC): Required. Without these properly configured and aligned, emails are rejected or routed to spam regardless of content quality.
- One-click unsubscribe: Required. Inbox providers expect compliance for bulk sends.
- Spam complaint rate below 0.3%: This is the hard ceiling set by Gmail. Google Postmaster Tools data shows domain reputation degradation begins before that threshold is reached. Sustained spam complaint rates above 0.1% are worth investigating.
- Hard bounce rate: Keep below 2%. A high bounce rate signals to inbox providers that the list contains purchased, scraped, or neglected addresses – all of which damage sender reputation.
Why engagement signals have become the new frontier:
A correct technical setup is the entry ticket. What determines inbox placement beyond that, particularly at Gmail, is engagement-based filtering. Gmail’s algorithms weigh how recipients interact with mail from your domain: do they open it, click it, or immediately delete it and mark you as spam? A list full of people who never engage with your emails is actively damaging your sender reputation with every send, regardless of how clean your authentication setup is.
This is why list hygiene and segmentation are not just list management practices – they are deliverability infrastructure. Sending to an engaged subset of your list protects your reputation for the sends that matter.
The practical benchmark: a healthy sending program should be hitting inbox placement rates of 85% or above for primary inbox (excluding promotions tab routing). Below 80% is a warning signal. Below 70% is an active problem with measurable revenue impact.
Campaign benchmarks by ecommerce category
Campaigns are manually scheduled sends to selected segments of your list. They drive promotional events, product launches, seasonal moments, and content-led communication. Understanding what “normal” looks like by category helps separate structural category behavior from actual program underperformance.
The data below draws primarily from Klaviyo’s 2026 benchmark analysis across 183,000+ brands and Omnisend’s 2025 ecommerce marketing report covering 20+ billion campaign emails.
Campaign placed order rate by category (2026 averages):
| Category | Avg. campaign placed order rate | Avg. campaign click rate |
|---|---|---|
| Food & Beverage | 0.26% | 1.70% |
| Health & Beauty | 0.19% | 1.24% |
| Toys & Hobbies | 0.19% | 2.03% |
| Clothing & Apparel | 0.12% | 1.83% |
| Home & Garden | 0.13% | 1.78% |
| Sporting Goods | 0.11% | 1.88% |
| Jewelry | 0.08% | 1.60% |
| Electronics | 0.09% | 1.85% |
| All categories (average) | 0.16% | 1.69% |
A few things are worth unpacking here.
Food & beverage leads on placed order rate because the products are consumable – purchase intent is often immediate, the price point is lower, and the consideration cycle is short. A campaign promoting a coffee subscription or a new snack variety doesn’t require a multi-week research phase. That context explains the number; it doesn’t make 0.26% a universal target.
Jewelry and electronics sit at the low end, not because their email programs are weaker, but because purchase cycles are longer and consideration is deeper. A customer who received an email about a $400 necklace and came back three weeks later to purchase it may not register as an email-attributed conversion in a last-click model. The campaign still influenced the decision.
The top 10% benchmark across all categories is 0.36% for placed order rate. If your campaigns are consistently below 0.10%, the issue is likely one of three things: segmentation (sending too broadly to people with no purchase intent), offer relevance (the campaign isn’t presenting something the audience needs), or deliverability (the emails aren’t reaching the inbox in the first place).
What campaigns are and are not supposed to do:
A campaign calendar built entirely around promotional discounts – 15% off this weekend, BFCM, end of season clearance – creates a Pavlovian problem. Subscribers learn that full-price purchases are unnecessary because a discount is always around the corner. Engagement outside of sale windows drops over time, which damages deliverability and conditions your best customers to buy only at reduced margins.
A more durable campaign strategy mixes promotional sends with content-led sends: product education, behind-the-scenes, customer stories, seasonal context that is not purely commercial. These emails don’t always generate direct revenue, but they maintain engagement between promotion cycles and protect the full-price purchase rate. The placed order rate benchmark for a well-structured, non-promotional campaign will naturally be lower – that is fine. It is doing a different job.
Automated flow benchmarks: conversion rates, placed order rates, and what they mean
Flows are behavior-triggered email sequences. They fire in response to specific actions: a subscription, a viewed product page, an abandoned cart, a completed purchase, a lapsing customer. They run continuously without manual input, and because they reach subscribers at moments of active intent or lifecycle transition, they convert at fundamentally different rates than broadcast campaigns.
The placed order rate for the average automated flow is around 2.11% – compared to 0.16% for campaigns. That 13x gap reflects timing and intent, not creative quality. Our deep-dive on Klaviyo flows for ecommerce covers the architecture and strategic intent behind each of these sequences in more detail.
Below are the core flows every scaled ecommerce brand should have in place, with the benchmarks that give you a realistic picture of what strong performance looks like.
Welcome series
The welcome series fires when a new subscriber joins your list. Its job is not just to deliver the signup incentive – it is to establish the brand, communicate why the product is worth buying, and move a cold subscriber toward a first purchase.
| Metric | Average | Top 10% |
|---|---|---|
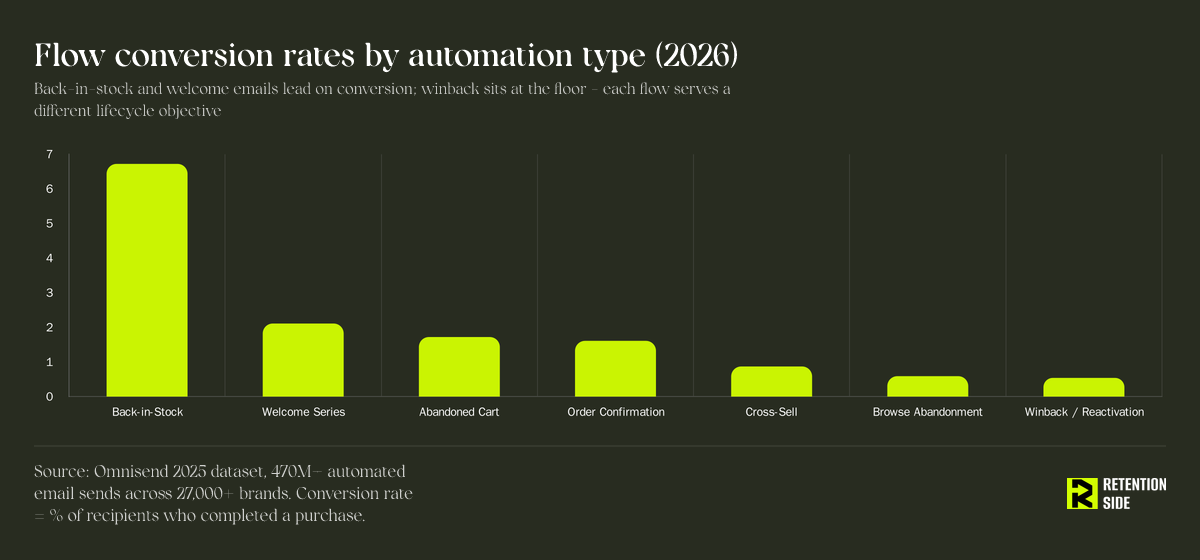
| Conversion rate | 2.11% | ~4%+ |
| Placed order rate | 2.32% | – |
| Click-to-conversion rate | ~58% | – |
The click-to-conversion rate of ~58% is the standout figure. More than half of the subscribers who click a link in a welcome email go on to purchase. That makes the quality of the CTA and the clarity of the offer in the welcome series disproportionately important.
The welcome series is also the highest-leverage point for zero-party data collection – preference data subscribers actively share at signup. A welcome series that captures what a subscriber is looking for and uses it to personalize subsequent emails outperforms generic sequences over time.
Abandoned cart
Abandoned cart targets high-intent shoppers who added products to their cart but did not complete checkout. Baymard Institute’s ongoing research places the documented average cart abandonment rate across ecommerce at close to 70%, making this one of the most commercially significant flows in the program. Our guide to Shopify abandoned cart emails covers the specific setup, timing logic, and deliverability considerations for this flow.
| Metric | Average | Top 10% |
|---|---|---|
| Placed order rate | 3.33% | 7.69% |
| Click rate | 6.25% | 13.33% |
The first email in an abandoned cart sequence – sent within 1-2 hours of abandonment while purchase intent is still warm – typically captures 45-55% of the total revenue the entire flow generates. That makes timing critical. A well-structured sequence also accounts for differences between first-time abandoners and returning customers: the framing, the incentive decision, and the urgency should all reflect where the person is in their relationship with your brand.
Browse abandonment
Browse abandonment fires when a subscriber views a product page but does not add to cart. The intent signal is weaker than cart abandonment, but the volume is much higher – most ecommerce stores have significantly more product page views than cart additions.
| Metric | Average |
|---|---|
| Placed order rate | 0.95% |
| Click-to-conversion rate | ~15.9% |
A browse abandonment flow requires clean behavioral event tracking in your ESP. If “viewed product” events are not firing reliably in Klaviyo, the flow will not trigger correctly. This is a common gap in programs that otherwise have reasonable flow architecture.
Post-purchase sequence
The post-purchase window is the highest-engagement moment in the entire customer lifecycle. A customer who just bought is at peak brand awareness, and what you do with that window is the single biggest determinant of whether they become a repeat buyer.
| Metric | Average |
|---|---|
| Placed order rate | 0.54% |
The 0.54% placed order rate understates the value of this flow because it captures direct same-sequence conversions only. The real return is the long-term second-purchase rate – the percentage of first-time buyers who go on to make a second purchase within a defined window. The post-purchase sequence’s contribution to that number is what matters most.
A strong post-purchase sequence is not a single “thanks for your order” email. It is a multi-email architecture covering product education (help the customer get full value from what they bought), cross-sell and upsell recommendations based on what was purchased, a well-timed review request, and a structured bridge toward the second purchase. The second purchase is the most predictive indicator of long-term retention – the post-purchase sequence is the best tool for engineering it. Research published in the Journal of Marketing Analytics confirms that early repeat purchase behavior is one of the strongest predictors of long-term customer lifetime value.
Cross-sell and upsell flows
These deserve their own architecture, separate from the general post-purchase sequence. They are triggered after purchase and designed to expand the customer’s footprint within your catalog – increasing both average order value over time and the breadth of their engagement with the brand.
| Metric | Average |
|---|---|
| Conversion rate | 0.87% |
| Revenue per email | $0.95 |
Effective cross-sell flows are built on actual purchase patterns in your catalog. If customers who buy product A consistently also buy product B within 60 days, that is a pattern to build a flow around – not a hypothesis to test.
Back-in-stock alerts
Back-in-stock emails are sent to subscribers who explicitly opted in to be notified when a sold-out item returns. These subscribers have already demonstrated strong purchase intent for a specific product, which explains why this flow has the highest conversion rate of any email type.
| Metric | Average |
|---|---|
| Conversion rate | 6.72% |
| Revenue per email | $9.14 |
| Click-to-conversion rate | 27.45% |
Only a small percentage of brands actively use this flow – which represents a genuine opportunity gap for brands with products that sell out and restock.
Win-back flows
A win-back flow is triggered around the point where a customer would historically be expected to repurchase but has not. For most ecommerce categories, that threshold is well within 90 days, based on the brand’s actual average repurchase cycle – not a generic number.
| Metric | Average |
|---|---|
| Conversion rate | 0.54% |
| Placed order rate | 0.9% to 1.4% |
Timing is everything here. A win-back triggered too late – after a customer has fully disengaged – converts poorly and increases unsubscribes. For categories with repurchase cycles under 60 days (supplements, consumables), a win-back flow triggered at 45 days is doing the job correctly. The same trigger at 120+ days, in a non-replenishment category, is largely wasted.
Win-back flows at late stages naturally carry higher unsubscribe rates (0.25-0.50% is expected). That is partly a list hygiene function: contacts who do not re-engage are candidates for suppression, which protects deliverability for the rest of the list. Win-back flows are not evaluated by their direct conversion alone – their contribution to list health is part of the value.
Repeat purchase rate benchmarks by niche
Repeat purchase rate (RPR) is the percentage of customers who make a second order within a defined time window. It is the most direct indicator of whether a retention program is actually working – more direct than any email metric, because it measures customer behavior in the store, not in the inbox. Understanding RPR in context is also central to measuring customer lifetime value for ecommerce, where repeat purchase behavior is the primary driver of LTV compounding.
The 90-day window is the standard operational measure for most categories. The 2026 DTC average sits at 25-30% on this basis.
That average is almost entirely useless without category context.
RPR benchmarks by ecommerce category (90-day window, 2026):
| Category | Average RPR | Top performer range |
|---|---|---|
| Supplements / consumables | 25-40% | 40-55% |
| Food & beverage (subscription) | 35-55% | Up to 60%+ |
| Beauty & skincare | 30-45% | Up to 45% |
| Pet supplies | 30-35% | 45%+ (subscription-driven) |
| Fashion & apparel | 25-32% | 35-40% (premium positioning) |
| Home goods | 15-25% | 25% (with strong cross-sell) |
| Electronics | 12-25% | 25% |
| Luxury & jewelry | 9-11% | 11% |
Why this spread exists:
The variation is structural, not operational. Consumables – supplements, coffee, skincare serums – have a natural replenishment cycle. The customer finishes the product and either reorders or churns. The repurchase is built into the product mechanic. Jewelry and luxury goods do not replenish. A customer who bought a high-value necklace last month is not in the market for another one this month. The purchase cycle is 12-36 months, and the relevant performance indicators are referral rate and second-purchase AOV, not 90-day RPR.
This is why a 22% RPR in fashion is a reasonable result. A 22% RPR in supplements is a serious retention problem – it is well below the category floor and signals either poor first-purchase experience, a broken post-purchase email sequence, or acquisition channel mismatch (low-intent traffic that was never likely to repurchase).
The first-to-second purchase conversion is the leverage point:
The hardest conversion in DTC retention is the first to the second purchase. Optimove’s analysis of repeat buyer behavior and Bluecore’s 2024 retail report both document how early purchase recurrence is the strongest structural predictor of long-term customer value. Cohort data consistently shows that customers who make a second purchase within 60 days of their first are around 3 times more likely to become long-term repeat buyers than customers who wait 120+ days. The 60-day repurchase window is a leading indicator of cohort lifetime value – measurable within two months of a customer’s first purchase, not 12 months later.
The implication is that the post-purchase sequence’s primary mission is not just cross-selling – it is engineering that second purchase as quickly as it is naturally appropriate, given the product and the category. Shortening the average time between first and second orders by even 15 days, at scale, produces a compounding revenue effect that no discount campaign can replicate.
RPR compounds across purchase stages:
- First to second purchase: 18-30% DTC median
- Second to third purchase: 35-55% (customers who have already repeated are much more likely to do it again)
- Third to fourth purchase: 55-75% (functionally loyal at this stage)
Investment in improving first-to-second conversion produces the highest leverage, because gains at that stage cascade into every subsequent stage.
List growth quality: what good looks like beyond subscriber count
List size is the most visible email metric and one of the least meaningful in isolation. What matters is the quality of who is on the list – specifically, how many of them buy.
The metric that captures this is lead-to-customer rate: the percentage of new subscribers who make a purchase within a defined window (typically 30 days) after joining the list. The Klaviyo setup guide for ecommerce brands covers how to structure the full list growth architecture – forms, incentives, and the connection between acquisition quality and downstream conversion – so that lead-to-customer rate becomes a meaningful operational metric rather than an afterthought.
A pop-up that fires immediately on every page for every visitor will produce large subscriber numbers. It will also capture a lot of low-intent traffic that inflates the list, drags down engagement metrics, and contributes to deliverability problems over time. The subscriber count looks healthy. The economics are poor.
A better benchmark: for a pop-up targeting behavioral intent signals (time on site, scroll depth, exit intent), a lead-to-customer rate of 6-10% within 30 days is a reasonable indication that the form is capturing subscribers with genuine purchase intent. Below 3% warrants looking at the traffic source and the signup incentive structure.
The incentive problem:
Most DTC brands default to a percentage-off discount as the signup incentive. It works in the sense that it increases form conversion. Whether it works in the sense of producing buyers who go on to become retained customers is a separate question that most brands are not asking.
A 15% off code that converts 10% of subscribers into first-time buyers within 30 days, at margins where the discount makes sense, is contributing genuine value. A 20% off code that converts 3% of subscribers into one-and-done buyers is a list-building cost that exceeds its long-term return. The incentive needs to be evaluated on lead-to-customer rate and subsequent retention, not form conversion rate.
List growth rate as a health signal:
Beyond quality, the rate of list growth itself matters for the long-term health of the program. A list that grows at 3-5% per month while maintaining good engagement metrics is building compounding capacity. A list that is flat or declining needs attention – either acquisition volume is insufficient, or churn (unsubscribes plus suppressions from sunset flows) is outpacing new additions.
A healthy ecommerce email list should be refreshing naturally through a mix of new subscribers and managed suppressions. The sunset flow – which removes chronically disengaged subscribers to protect deliverability – is the mechanism for the latter. Its function is list hygiene, not revenue generation. Do not evaluate it as a performance flow.
How to diagnose underperformance without optimizing the wrong thing
When email performance drops, the instinct is to fix the email. That is often the wrong starting point. The cause is frequently upstream of the channel. A Klaviyo audit checklist provides a structured diagnostic framework for working through each pillar – deliverability, list health, flow coverage, and campaign strategy – in the right sequence.
If lead-to-customer rate has declined:
Look at traffic quality before you look at the email program. A shift in paid acquisition strategy that brings in broader, lower-intent traffic will reduce lead-to-customer rate regardless of how strong the welcome series is. The email program did not change – the audience coming through it did.
If repeat customer rate is flat despite email investment:
Check whether the core lifecycle flows are actually functioning: are abandoned cart emails firing reliably? Is the post-purchase sequence completing? Are win-back flows triggering at the right time based on actual repurchase cycle data? A flat repeat customer rate despite a seemingly active email program often traces back to flows that are not triggering correctly, not to content quality.
If campaign conversion rates have declined progressively:
Check the segmentation. A gradual decline in campaign conversion is usually a sign that the audience being targeted has become less relevant over time – either because segmentation has not evolved with the list, or because the balance has tilted too far toward promotional sends, conditioning the audience to disengage during non-sale periods. Our guide to Shopify email marketing strategy covers how to structure campaign frequency and segmentation to avoid this pattern.
If deliverability indicators are degrading:
Deliverability problems compound. A spam complaint rate creeping toward 0.1% will not immediately show in conversion numbers, but it will show in inbox placement within weeks, and in conversion numbers within months. Monitoring Google Postmaster Tools and Klaviyo’s Deliverability Hub regularly gives you early warning that is much cheaper to act on than a full reputation repair.
At Retention Side, the diagnostic sequence we run for brands with underperforming email programs almost always starts with deliverability, then list health, then flow coverage and trigger reliability, and finally creative and offer quality. The order matters because fixing the downstream layer without addressing the upstream problem produces temporary improvement at best.
The benchmark data in this article is most useful when it prompts the right question – not “why is our open rate lower than the industry average?” but “what does our flow conversion rate tell us about where the customer lifecycle is breaking down, and what does our repeat customer rate tell us about whether we are retaining the customers email is supposed to be retaining?”
Those are the questions that connect benchmarks to business outcomes.
Conclusion
Benchmarks in email marketing serve one useful purpose: they give you context for your own numbers. They tell you whether a placed order rate of 1.8% in your abandoned cart flow reflects a solid program or a significant opportunity, and they help you calibrate what “strong performance” actually looks like for your category, your price point, and the stage your program is at.
What they do not do is tell you what to fix. A benchmark below average is a signal to investigate, not a directive to rebuild.
The most durable principle in ecommerce email is this: the metrics that matter are the ones connected to customer behavior – repeat purchase rate, lead-to-customer rate, time between orders, revenue attributed to the channel, and deliverability indicators that show whether emails are reaching inboxes. Everything else is a diagnostic input, not a performance target.
If your email program is active but your repeat customer rate is not moving, the issue is almost always structural – in the flow architecture, the segmentation, the deliverability foundation, or the list quality. Those are fixable problems, but they require diagnosis before they require creative.
That structural work is exactly what Retention Side focuses on when working with ecommerce brands. Email via Klaviyo is the entry point. Building the retention system that makes those benchmarks compound over time is the point.