


Customer lifetime value gets talked about constantly in ecommerce circles, but most of the conversations around it are imprecise in ways that lead to poor decisions. Brands either track LTV as a vanity metric without acting on it, calculate it against gross revenue when contribution margin is what actually matters, or use it loosely without tying it to the retention infrastructure that actually moves the number.
This article is a practical guide to what LTV really is in ecommerce, how to calculate it correctly, what actually drives it, and how to use it as a strategic lever rather than a dashboard decoration.
Key takeaways
- Customer lifetime value is a measure of the total contribution a customer generates over their relationship with your brand – not just the revenue they spend.
- LTV calculated on revenue rather than contribution margin overstates customer profitability by 40-70% in most ecommerce businesses. The number that should drive acquisition and retention decisions is margin-adjusted LTV.
- A “good” LTV is always relative to your category, your average order value, your repurchase cycle, and your acquisition cost. There is no single universal benchmark.
- The LTV:CAC ratio is the most practical use of LTV data. A healthy range for DTC ecommerce brands sits between 2.5:1 and 4:1 on a 12-month cohort basis using contribution margin – not the SaaS-derived 3:1 rule that gets misapplied everywhere.
- The 80/20 principle applies strongly in ecommerce: typically 20% of customers generate 80% of revenue. The strategic implication is that identifying, retaining, and replicating your top-tier customers is a higher-leverage activity than trying to uniformly improve LTV across the entire base.
- LTV is not a fixed attribute of a customer. It is a metric that responds directly to what you do after the first purchase – how you communicate, what channels you use, how you time outreach, and whether your retention system is actually built.
- Open rate, click rate, and revenue per recipient are not LTV-relevant metrics. They tell you nothing about whether your retention infrastructure is building long-term customer value.
What you’ll learn
- What customer lifetime value actually means in ecommerce – and how to calculate it correctly
- Why the method of calculation matters as much as the result
- What the 80/20 rule reveals about your customer base
- How to interpret the LTV:CAC ratio for DTC brands (and why the 3:1 rule is wrong)
- What “good” LTV looks like by ecommerce vertical
- The retention levers that actually move LTV
- How to connect LTV strategy to your email and retention channel stack
What is customer lifetime value in ecommerce?
Customer lifetime value (also written as CLV or LTV) is the total net value a customer generates over their entire relationship with your brand. In ecommerce, this translates to the sum of their purchases, minus the costs associated with serving them, from the moment they first bought until they stopped buying.
The concept is straightforward. The calculation is where most brands go wrong.
The most common version of LTV in ecommerce looks like this:
LTV = Average Order Value × Purchase Frequency × Customer Lifespan
This formula is useful as a rough orientation, but it has real limitations. It ignores churn. It uses gross revenue instead of margin. And “customer lifespan” in ecommerce is not a fixed number – it decays over time, and predicting how long a customer relationship will last is not as clean as a formula implies.
The version that actually drives good decisions looks different:
LTV (margin-adjusted) = Net revenue per customer over a defined period × Gross margin
Or, more precisely for acquisition and budgeting decisions, the contribution margin (CM2) version:
LTV = (Net revenue per customer over 12 months) – (COGS + fulfillment + payment fees + returns reserve)
The reason this distinction matters is significant. A customer who generates $400 in lifetime revenue at a 35% gross margin (after COGS, fulfillment, and payment processing) has a real LTV of around $140. If you calculate LTV on revenue and use it to set your maximum allowable acquisition cost, you will consistently overspend on paid media and discover the economics do not hold at scale.
The “LTV” figure shown in Shopify analytics, Triple Whale, and most attribution dashboards is technically lifetime revenue, not lifetime value. It is a useful signal for relative comparisons and trend tracking. It should not be the number that determines how much you pay to acquire a customer.
For serious strategic decisions – setting CAC targets, evaluating channel ROI, or making a case for retention investment – use the margin-adjusted figure, applied over a defined time window. In most transactional DTC businesses, 12 months is the right window. Predictive accuracy drops significantly beyond that because consumer preferences shift, product mix changes, and the competitive landscape moves. A “5-year LTV” projection for a DTC brand is usually a marketing artifact, not a finance number.
Why the calculation method changes everything
The gap between revenue-based LTV and margin-adjusted LTV is not a rounding error. In a typical DTC business with gross margins of 40-55%, the difference is 40-70% of the headline number. That is the difference between believing you can afford a $90 CAC and actually affording a $45 one.
There are also two additional factors that most LTV calculations ignore:
Returns. A 25% return rate in an apparel business reduces net revenue per customer by more than most LTV models account for. If you run cohort LTV on gross order value without subtracting returns, your number is meaningfully overstated – sometimes by 15-25%.
Churn pattern. The naive LTV formula assumes that purchase frequency stays constant. In reality, most ecommerce customers follow a decay curve: a high probability of a second purchase if the first went well, declining probability with each subsequent period they go without ordering. Modeling LTV as a flat multiple of purchase frequency misses this decay and produces an optimistic number.
This does not mean you should abandon LTV as a metric. It means using it precisely and consistently – same definition, same time window, same cost inclusions – every time you calculate it, so that comparisons across cohorts and periods are actually meaningful.
What the 80/20 rule reveals about your customer base
The Pareto Principle – the observation that roughly 80% of outcomes come from 20% of inputs – appears consistently in ecommerce customer data. In most DTC businesses, a relatively small segment of repeat buyers generates the majority of total revenue.
The exact distribution varies by brand and category, but the pattern is consistent enough that it should shape how you think about retention investment. Smile.io’s 2025 State of Ecommerce Customer Loyalty report, which analyzed 585 million orders across more than 100,000 merchants, found that loyal customers account for 44% of total revenue and 46% of total orders despite representing just 21% of a typical brand’s customer base. Smile.io also found that the top 5% of customers alone generate approximately 35% of total store revenue – a concentration that makes the strategic case for protecting your best customers far more compelling than any blanket acquisition push. Some analyses of DTC purchase data push this concentration further, with as few as 4-5% of customers generating more than 60% of lifetime revenue when you account for purchase frequency, order value, and tenure.
What this means practically:
Identifying your top 20% is the first step in building a real LTV strategy. These customers have already proven their value. Your retention investment should be designed, at minimum, to protect and deepen those relationships – through VIP communication, tiered loyalty programs, personalized outreach, and direct mail for segments that have gone quiet across digital channels.
Replicating your top 20% is the second step. The behavioral and demographic profile of your best customers is some of the most actionable data your business holds. It should feed back into paid acquisition targeting (lookalike audiences based on high-LTV cohorts), into content strategy (what messaging resonated with buyers who came back), and into onboarding flows (what experience moved first-time buyers most quickly to a second purchase).
The bottom 80% are not equally valuable. Some of your one-time buyers are genuinely price-shoppers who will never return regardless of your retention investment. Others are one-time buyers who had a good experience and simply haven’t been communicated with effectively. The difference matters for how you allocate resources – and it is only visible when you segment by behavior rather than treating all customers as one audience.
The 80/20 lens also applies to products. Most ecommerce stores have a handful of SKUs that generate the majority of revenue, a handful of ad creatives that drive the majority of conversions, and a handful of retention flows that produce the majority of email-attributed revenue. Knowing which 20% is pulling the weight in each area tells you where to invest and, just as importantly, what to stop optimizing.
LTV benchmarks by ecommerce vertical
LTV is always relative. A $200 average LTV is strong performance in general retail and thin in luxury goods. Before benchmarking your LTV against any external number, category context is the first thing to get right.
The figures below are revenue-based ranges (not margin-adjusted), drawn from multiple published 2026 sources. They are starting points for orientation, not precision targets. Subscription penetration, average order value, and brand positioning within a category all affect where a specific brand lands within these ranges.
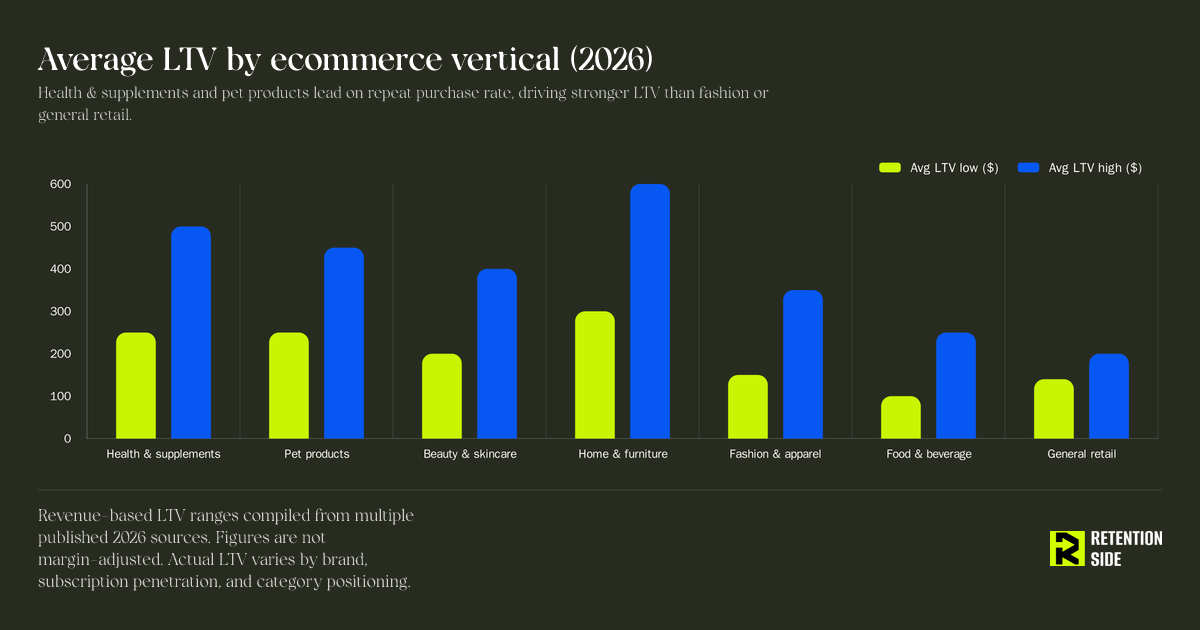
Health and supplements: $250-$500
The strongest repeat rates in ecommerce. Products are consumable, habits form around daily use, and customers who believe a supplement is working rarely stop. Subscription models push LTV toward the top of this range.
Pet products: $250-$450
Among the most consistent LTV profiles in DTC. Pets need food and supplies on a regular cycle, and the emotional attachment to a trusted brand creates genuine switching costs.
Beauty and skincare: $200-$400
Replenishment-driven. Customers who find a routine they trust reorder predictably. Subscription models double LTV relative to transactional models in this category. A repeat rate below 35% in beauty warrants attention.
Home goods and furniture: $300-$600
High AOV compensates for low repeat frequency. Home purchases are infrequent by nature. The challenge – and the opportunity for retention channels – is staying relevant during the long gaps between transactions.
Fashion and apparel: $150-$350
Wide variance by positioning. Basics brands (activewear, innerwear) outperform occasion-wear brands on repeat frequency. The 25-35% repeat rate typical of apparel means most brands lose the majority of first-time buyers – closing that gap is the biggest LTV opportunity in the category.
Food and beverage: $100-$250 (non-subscription), $400-$800 (subscription)
The subscription model transforms this category’s economics. Non-subscription food brands have some of the lowest LTVs in ecommerce because the product is easily substituted.
General retail: ~$140-$200
The baseline. If your niche-specific LTV is close to general retail, you are likely not capturing the category-specific dynamics that should push it higher.
Two things to take away from these ranges. First, health and beauty inherently produces higher repeat rates than sporting goods or outdoor equipment – this is structural, not operational. Second, within any vertical, top-performing brands achieve 2-3x the category average. The difference is almost always the depth of the retention system behind the brand.
What is a good LTV:CAC ratio?
LTV on its own is not a decision-making metric. It needs a counterpart: customer acquisition cost (CAC). The LTV:CAC ratio answers the question your unit economics ultimately rest on – for every dollar spent acquiring a customer, how many dollars of value do they return?
The commonly cited benchmark is 3:1. Harvard Business School Professor Christina Wallace describes a 3:1 ratio as “attractive” for scalable businesses where marketing costs, overhead, and profit are all covered. But that benchmark originates in SaaS and startup economics – where LTV is calculated against multi-year recurring subscription revenue with high gross margins. In ecommerce, the definition of LTV is fundamentally different – transactional, lower-margin, with a repeat curve that decays – which makes the 3:1 rule a poor fit for most DTC brands.
The right framework for DTC ecommerce:
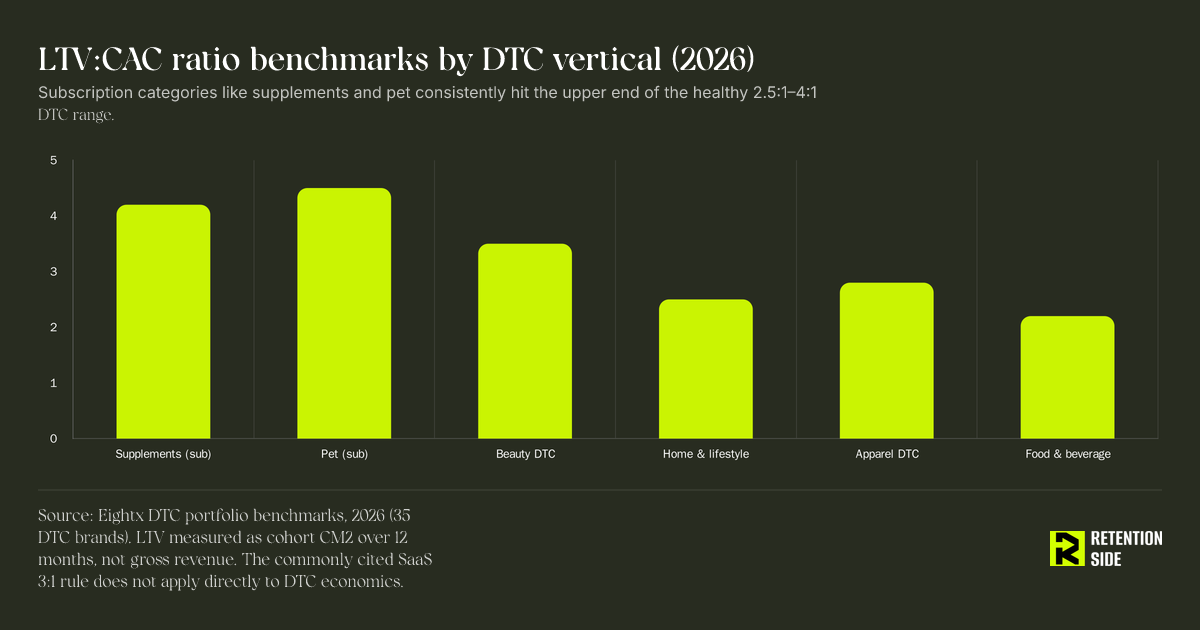
A healthy LTV:CAC ratio for transactional DTC sits between 2.5:1 and 4:1, measured on contribution margin (not revenue) over a 12-month cohort window, with CAC cohort-matched to the same acquisition period.
The boundaries matter:
- Below 2.5:1: You are likely underwater on unit economics. Either reduce CAC or build the retention infrastructure that improves LTV before scaling further.
- 2.5:1 to 4:1: Healthy operating range for most DTC categories. The specific target within this range depends on your funding stage, category margins, and payback tolerance.
- Above 4:1: Usually a signal that you are under-investing in acquisition and ceding market share to competitors who can afford to bid more aggressively.
The payback period matters as much as the ratio. Two brands can have identical 3:1 ratios with very different cash profiles. A brand at 3:1 with a 4-month CAC payback is cash-efficient and can scale aggressively. A brand at 3:1 with a 14-month payback needs outside capital to fund the gap. For bootstrapped or lean-funded ecommerce businesses, CAC payback under 6 months is a more practical constraint than the ratio itself.
A critical note on CAC calculation. Most brands report a “reported” LTV:CAC that is 1.5-2x their real ratio because they calculate LTV on gross revenue and use current-month CAC against historical LTV cohorts. Fix the reporting first. A ratio that looks healthy on a dashboard but is actually miscalculated is worse than no ratio, because it produces false confidence in acquisition decisions.
What about returns? In high-return categories like apparel, returns can reduce real LTV by 15-25%. A brand reporting 3:1 on gross order value with a 20% return rate may have a real ratio of 2.2:1 once returns are honestly modeled. Always calculate LTV on net revenue after refunds.
What is a good customer lifetime value?
There is no universal answer because “good” LTV depends on the interaction between your category, your average order value, your repurchase frequency, your gross margin, and your acquisition cost.
The most useful framing is directional:
- Is your LTV growing quarter over quarter? This is the signal that your retention system is working – more customers coming back, coming back sooner, and spending more per order over time.
- Is your LTV:CAC ratio within the 2.5:1-4:1 band? If yes, your unit economics are functional. If no, the gap tells you whether the problem is on the acquisition cost side or the retention side.
- Is your LTV above the category baseline for your vertical? If your LTV is at or below the general retail average despite operating in a replenishment category, your retention infrastructure is not doing its job.
The customer cohort lens is more actionable than the aggregate average. Brands with healthy LTV programs see clear cohort curves: customers acquired in any given month generate more value in month 2 than month 1, more in month 3 than month 2, with declining but still positive increments over time. A flat or immediately decaying cohort curve – where nearly all value is captured in the first order – is the diagnostic that something in the retention system is missing.
One nuance worth naming: a high LTV concentrated in a very small segment of customers is not the same as a high average LTV across a broad, well-distributed customer base. If your LTV looks good only because 3-5% of customers are spending disproportionately, the business is fragile. Diversifying LTV across a larger segment of your customer base through retention investment is more durable than protecting a small whale segment.
The retention levers that actually move LTV
LTV is not a fixed property of a customer. It is a reflection of what happens after the first purchase – the quality of the experience, the relevance of the communication, the strength of the incentive to come back, and the coordination of the channels that make up a real retention stack through which all of that is delivered.
The levers below are the ones that consistently move LTV for ecommerce brands. They are not independent tactics – they interact, and building them as a system produces compounding results.
The second purchase is the most predictive event
After a first order, the probability of a customer buying again sits around 27%. After a second order, that probability roughly doubles to 54%. The second purchase is not just incremental revenue – it is the inflection point that separates customers who will contribute meaningfully to LTV from those who will contribute once and disappear.
This means the highest-leverage moment in your entire customer lifecycle is the window between first and second purchase. How you communicate during that window – through post-purchase education, cross-sell recommendation, a deliberate bridge toward the next order – largely determines which direction the customer goes. Most ecommerce brands underinvest in this window entirely, sending a shipping confirmation and a review request and then going quiet. Our guide on how to increase repeat purchases in ecommerce covers the specific mechanics of this window in detail.
Post-purchase sequences, not just confirmation emails
A post-purchase email sequence is not a logistics update. Its job is to use the window of peak customer engagement (right after a purchase) to build the relationship that produces a second order. That means product education that helps the customer get real value from what they bought, a cross-sell introduction based on what they purchased, a review request timed for when they have actually used the product, and a deliberate prompt toward the next purchase.
The strategic intent is not “email automation” – it is lifecycle engineering at the most commercially critical moment. A well-structured ecommerce email marketing strategy maps these sequences to the exact moments in the customer journey where a timely message changes behavior.
Cross-sell and upsell flows driven by purchase data
Customers who buy multiple products from a brand have materially higher LTV than single-product buyers. Every additional product a customer uses deepens their relationship with the brand and increases the switching cost of going elsewhere.
The most effective cross-sell flows are built on actual purchase behavior patterns – which products do customers consistently buy together, and in what sequence? If customers who buy product A consistently purchase product B within 60 days, that relationship should be encoded into an automated flow triggered after a product A purchase. Not guessed based on category logic, but built on observed data.
Win-back timing calibrated to your actual repurchase data
Win-back flows are triggered around the point where a customer would be expected to repurchase based on your brand’s average order frequency data, but hasn’t. The timing is everything. In most ecommerce categories this window is well within 90 days. A win-back flow that fires 6 months after a customer should have reordered in a 30-day repurchase category is not a retention tool – it is a formality.
Calibrating win-back timing to your actual purchase interval data (not an industry average, not a default setting) is one of the single highest-impact adjustments most brands can make to their existing flow architecture. The Klaviyo audit checklist we use with new clients covers exactly this – most brands find their win-back trigger is set 2-3x later than it should be.
Loyalty programs as structural retention infrastructure
A loyalty program is not a communication channel. It is a structural retention mechanism – a reason for customers to consolidate spending with your brand rather than spreading it across competitors. The psychological driver is simple: once a customer has accumulated points or reached a tier, leaving means walking away from accumulated value.
According to Smile.io’s 2025 State of Ecommerce Customer Loyalty report – which analyzed 585 million orders across more than 100,000 merchants – loyalty-generated value grew year-over-year across every major ecommerce industry in 2024, with CPGs seeing a 13.95% increase in purchase frequency among loyalty members. That compounding engagement is precisely what a well-structured program unlocks.
The programs that produce meaningful LTV lift go beyond simple points-per-dollar structures. Tiered status gives customers something to progress toward. Experiential rewards and early access create value that is not purely transactional. And when the loyalty program is integrated with your email and SMS stack – points balance reminders, threshold alerts, milestone triggers – the communication channels and the structural incentive reinforce each other.
Loyalty programs only make financial sense at a scale where there are enough customers at each tier for the program to generate positive ROI. If you are still building the foundational retention system, get that right first.
Direct mail for high-value segments
The physical mailbox has gotten quieter as digital channels have expanded. A well-designed postcard can sit on a counter for days. A personalized letter reaches a lapsed VIP customer in a way that a fifteenth re-engagement email simply cannot.
Direct mail earns its place in a retention stack not as a broadcast tool but as a precision instrument: win-back campaigns for high-LTV customers who have gone quiet across digital channels, premium unboxing inserts targeted to first orders above a certain AOV threshold, and personalized offers for customers close to a loyalty tier milestone. The cost per piece is higher than digital, which is why the targeting has to be deliberate.
Coordinating channels around the customer lifecycle
A retention system where email, SMS, push notifications, direct mail, and loyalty programs all operate independently – without awareness of what the other channels are doing – is not a system. It is a collection of tools. A customer who received an SMS offer yesterday should not get the same offer via email today. A loyalty member who just redeemed a reward should not enter a win-back sequence tomorrow.
Channel coordination is what separates a retention stack that feels intentional from one that feels automated in the bad sense. The coordination happens at the data layer – making sure profile events, purchase history, and channel engagement data are flowing correctly and being used to govern what gets sent, when, and through what channel. A proper ecommerce retention agency builds this at the systems level, not channel by channel.
How email connects to LTV
Email is almost always the starting point for building a retention system that moves LTV. It has the widest reach into your existing customer base, the most flexibility for behavioral automation, and the lowest cost per communication of any owned channel.
But “doing email” and “having a retention system” are not the same thing. A Klaviyo account with a welcome series and weekly promotional blasts is not a retention infrastructure. The gap between those two things is measurable in repeat purchase rate and LTV. Harvard Business Review has documented that acquiring a new customer costs five to seven times more than retaining an existing one – which means every email that fails to drive a second purchase is a real economic cost, not just a missed opportunity.
A properly built email program rests on four pillars, all of which have to function for the channel to drive LTV:
Deliverability – the prerequisite. An email that routes to spam or the promotions folder does not generate LTV. Deliverability is not a one-time setup. It requires ongoing management of sender reputation, list hygiene, authentication records, and send consistency. A brand with strong flows and well-segmented campaigns can still have a flat LTV if those emails are not reaching inboxes at scale.
List growth – the fuel. The metric that matters here is not form submission rate or subscriber count. It is lead-to-customer rate: of the new subscribers who joined this month, what percentage made a purchase within a defined window? A smaller, commercially intent list outperforms a large, low-quality list on every LTV-relevant metric. Our breakdown of the top email marketing metrics for ecommerce explains why lead-to-customer rate is the list growth signal that actually matters.
Automated flows – the always-on engine. Flows generate LTV continuously by mapping communication to the exact moments in the customer journey where a timely message changes behavior. Post-purchase sequences, cross-sell and upsell flows, win-back flows, and browse abandonment flows are the core LTV-driving automations. They should be actively maintained and tested, not built once and left. A Klaviyo setup guide covers the technical and strategic architecture behind each of these flows.
Campaigns – the relationship layer. Campaign strategy that is exclusively promotional trains subscribers to wait for discounts before purchasing, which erodes full-price buying over time and compresses LTV. A durable campaign strategy alternates promotional sends with educational and value-driven content that maintains engagement between promotion cycles.
Campaigns and flows are equally important. A program built entirely on automation will eventually feel robotic. A program built entirely on campaigns works harder than necessary and misses the compounding effect of behavioral automation. Both need to be working together.
Metrics that tell you whether LTV is improving
Most ecommerce email platforms surface open rate, click rate, and revenue per recipient as primary metrics. None of these directly measure LTV improvement. They are diagnostic signals – useful for identifying problems in specific emails, not for measuring whether your retention system is building long-term customer value.
The metrics that actually matter:
Returning customer rate (repeat purchase rate) – the clearest single measure of whether your retention investment is working. If this number is growing quarter over quarter, customers are coming back more often. If it is flat despite significant channel investment, there is a structural gap somewhere in the system.
Revenue attributed to retention channels – what your email, SMS, and other owned channels are contributing to total store revenue over time. This should be tracked relative to investment and interpreted with nuance, since attribution across channels is never perfectly clean.
Average time between orders – for brands with replenishable products, this is one of the most informative LTV signals available. If the gap between first and second purchase is shortening, your post-purchase and cross-sell sequences are doing their job. If it is lengthening, something has shifted in either the communication or the product experience.
List growth rate with lead-to-customer rate as a companion – a list that grows in volume but not in commercial quality is a deliverability liability over time.
Flow-level conversion metrics – for each core automation, what percentage of customers who enter the flow complete the target action? These granular metrics tell you which parts of the automation layer are working and which need attention.
What should not drive strategy: open rate, click rate, and revenue per recipient. These are activity metrics. An agency or internal team that leads performance conversations with open rates is optimizing for the wrong thing. When evaluating the quality of a retention program, always ask what business-level metrics it is moving – not what the dashboard numbers look like on send day.
Why LTV stays flat despite investment
When brands invest in email, automation, and retention channels but LTV does not move, the root cause is usually one of these:
The lifecycle has gaps. Flows are present but do not cover the full customer journey. There is a welcome series and an abandoned cart flow, but no meaningful post-purchase sequence, no cross-sell architecture, and a win-back flow triggered so late it is rarely effective. The moments where communication could most influence a second purchase are either not automated or are automated with thin, generic content.
Campaign strategy has trained customers to wait for discounts. A promotional calendar built exclusively around percentage-off messages produces an audience that only engages when there is a deal. Full-price purchasing declines. Engagement outside sale windows deteriorates. Deliverability follows, because inbox providers read low engagement as a signal that emails are not wanted.
Flows were built once and never revisited. A post-purchase sequence written 18 months ago with an old incentive structure and a catalog that has since expanded is not doing the job it could. Flows need regular audits, testing, and updates. Static automation decays.
The performance drop is not an email problem. A decline in LTV is not always caused by a gap in the retention channel. It can reflect a change in acquisition traffic quality – lower-intent customers from a new paid campaign who were never likely to become repeat buyers. It can reflect a website conversion issue. It can reflect a product quality problem surfacing in post-purchase satisfaction. Diagnosing root cause before rebuilding strategy prevents a lot of misdirected effort.
Channels run in silos. Email, SMS, push notifications, direct mail – all active, none communicating with each other. The result is message overlap, competing offers, and a fragmented customer experience that reads as disorganized rather than attentive. Coordination is not optional at any meaningful scale. Understanding what an ecommerce retention agency actually does starts with recognizing that the agency’s job is to build and coordinate the full system – not just manage a single channel.
At Retention Side, the first thing we look at when LTV is flat despite existing channel activity is the structural coverage of the lifecycle – where the gaps are, what the win-back timing looks like relative to actual purchase interval data, and whether the campaign strategy has conditioned the list to wait for discounts. Those three things account for the majority of cases where brands are investing in retention without seeing it in the numbers.
Frequently asked questions
What is customer lifetime value in ecommerce?
Customer lifetime value in ecommerce is the total net value a customer generates over their entire relationship with your brand – from first purchase through every subsequent order, minus the costs of acquiring and serving them. In practice, LTV is usually calculated as a revenue-based figure over a defined time window (typically 12 months for transactional DTC), though decisions about acquisition budgets and retention investment should use a margin-adjusted version that accounts for COGS, fulfillment, payment fees, and returns. The metric tells you how valuable a customer is on average – but the more actionable version is cohort LTV, which tells you how different groups of customers acquired in the same period perform over time.
What is the 80/20 rule in ecommerce?
The 80/20 rule, or Pareto Principle, in ecommerce describes the tendency for a small proportion of customers to generate a disproportionately large share of revenue. Smile.io’s 2025 research finds that loyal customers – roughly 21% of a typical brand’s customer base – account for 44% of total revenue, and that the top 5% of customers alone generate approximately 35% of total store revenue. Some analysis of DTC purchase data finds concentration even steeper than the classic 80/20 split. The strategic implication is clear: identifying your highest-LTV customers, protecting those relationships, and using their behavioral profile to acquire similar customers is more efficient than trying to uniformly improve performance across the full base. The principle also applies to products, ad creatives, and marketing channels – in each dimension, a small number of inputs typically drives most of the results. Knowing which 20% is pulling the weight in your specific business is the prerequisite for intelligent resource allocation.
What is a good LTV:CAC ratio for ecommerce?
For DTC ecommerce, a healthy LTV:CAC ratio sits between 2.5:1 and 4:1 on a 12-month cohort basis, with LTV measured as contribution margin rather than gross revenue. The widely cited 3:1 benchmark – referenced by Harvard Business School as a general indicator of a scalable business – comes from SaaS economics, where LTV is calculated over a multi-year recurring revenue stream with high gross margins – a fundamentally different model than transactional DTC. Below 2.5:1 and you are likely not recovering acquisition costs before the cohort churns. Above 4:1 typically means under-investing in acquisition and ceding market share. The ratio should always be read alongside CAC payback period – a 3:1 ratio with a 4-month payback is structurally very different from a 3:1 ratio with a 14-month payback, even if the headline number looks the same.
What is a good customer lifetime value?
There is no universal figure. A $200 LTV is strong in general retail and thin in luxury goods. The most useful benchmark is always your own category range, your own directional trend, and the LTV:CAC ratio that results when set against your actual acquisition cost. If your LTV is growing quarter over quarter, your cohort curves are not decaying immediately after the first order, and your LTV:CAC sits within the 2.5:1-4:1 band on margin-adjusted LTV – those are the signs of a healthy LTV program, regardless of the absolute number.
Conclusion
Customer lifetime value is the metric that determines whether your ecommerce growth is sustainable or structurally dependent on an ever-more-expensive acquisition cycle.
Getting it right requires two things. First, calculating it correctly – on contribution margin, over a defined 12-month window, cohort-matched, with returns modeled in. Second, building the retention infrastructure that actually moves it – post-purchase sequences that engineer the second purchase, cross-sell flows built on real purchase data, win-back timing calibrated to your actual repurchase interval, loyalty programs that create structural reasons to stay, and channel coordination that makes the entire system feel intentional rather than automated.
The brands that compound on LTV are not doing more marketing. They are doing more specific marketing – at the right moment in the lifecycle, on the right channel, with messaging that reflects where the customer actually is in their relationship with the brand.
That is the system Retention Side is built to construct. Email via Klaviyo is almost always the entry point because it is where the most immediate, measurable LTV lift lives. But what the system looks like beyond email – whether SMS, push notifications, direct mail, a loyalty program, WhatsApp, or Viber belong in the stack – depends entirely on what the customer behavior data tells us about where to invest next.
If your LTV has been flat despite investment in retention channels, the issue is almost certainly structural. That is the kind of problem a properly built retention system is designed to close.