

Email marketing metrics that matter
Most eCom brands track the wrong email metrics. This is happening simply because the wrong ones are front and center in every dashboard. Tracking the right KPIs is what separates brands that scale through retention from brands that just… send emails. Let’s break down what to ignore, what to measure, and how to set benchmarks that mean something.
The metrics you should stop obsessing over
Before we get to the good stuff, we need to clear the table. Some of the most popular email marketing metrics are not just useless – they are actively misleading. And the problem is, most ESPs, like Klaviyo, and average service providers push these front and center on their dashboards, making it easy to assume they matter more than they actually do.
Open Rate
Open rate is probably the most talked-about metric in email marketing, and ironically, one of the least actionable. There is one reason you should keep an eye on it – if your open rate is consistently very low, you likely have a deliverability issue. Deliverability is the backbone of everything in this channel, so if you’re seeing unusually low open rates, that is your signal to investigate your sender reputation, list hygiene, and email authentication setup. Beyond that red-flag scenario, though, chasing a higher open rate is a bit of a distraction.
That’s mainly because your open rate is largely a reflection of things that live outside your email program. If your subscribers came from low-quality (intent) traffic, your open rate will naturally be lower. Industry authority matters too – brands that people actively follow and trust get opened more, full stop.
You can run subject line A/B tests, experiment with send times, or try different segments, and yes, you might see small improvements. But you are not going to move from 40% to 70% through email optimizations alone. That kind of growth comes from building a better brand, a better audience, and a stronger reputation.
And here is the reality check that should make this very clear: you can have a 100% open rate on a campaign and generate exactly zero dollars in revenue from it. Open rate tells you nothing about whether your email marketing is actually working.
Submit Rate (Form Conversion Rate)
Building your list is essential, subscribers are the fuel that keeps this channel running. But how many of those subscribers actually matter? That is the question most brands are not asking.
A high submit rate on your pop-up or signup form looks great. But if the people filling out that form never buy anything, what did you actually accomplish? Similar to open rate, you can have a submit rate that crushes every industry benchmark and still end up with zero purchases from those new subscribers.
Your real job is to understand how many of those fresh subscribers actually turn into customers. We will show you exactly how to measure that in the sections below.
Revenue Per Recipient
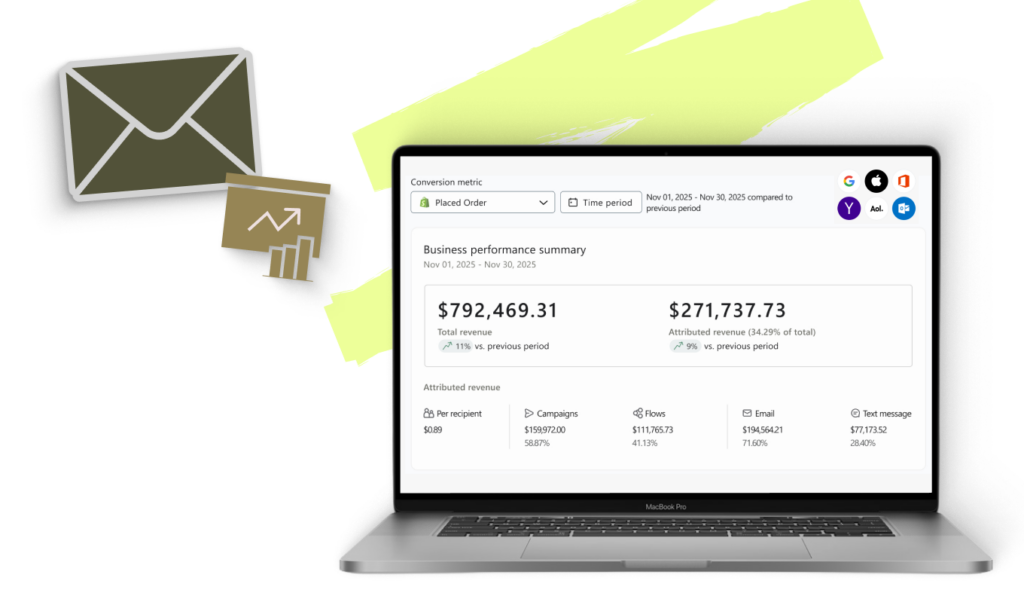
This one became popular largely because Klaviyo and similar platforms put it in a prominent spot on their analytics dashboards. And it sounds logical on the surface – how much revenue does each email generate per person it reaches?
The problem is that not every email is built to drive immediate revenue. Some emails are designed to educate your audience. Some are purely relationship-building touchpoints. If you judge every email on revenue per recipient, you will start cutting the emails that actually build long-term loyalty in favor of promotional blasts.
And that is a strategy that burns out your list fast. Looking at this metric at the account level gives you a distorted picture that can lead to really poor strategic decisions.
The 5 Metrics That Actually Matter
Now for the good part. These are the metrics our team at Retention Side tracks for every client, across every engagement. They are not the flashiest numbers in your dashboard, but they are the ones that will tell you exactly how healthy your email program is and where to push next.
1. Lead to Customer Rate
This is the metric that tells you whether your list-building strategy actually works, not just at capturing emails.
The subscription form has two jobs. First, it converts website traffic (whether that traffic came from paid ads or organic search) into subscribers, giving you a cost-effective way to keep communicating with people who showed interest. Second, it starts the zero-party data collection process that helps you personalize everything that comes after. If the people coming in through those forms never buy, both of those jobs are failing.
Lead to Customer Rate gives you a clear answer on whether your top-of-funnel email strategy is converting.
How to measure it:
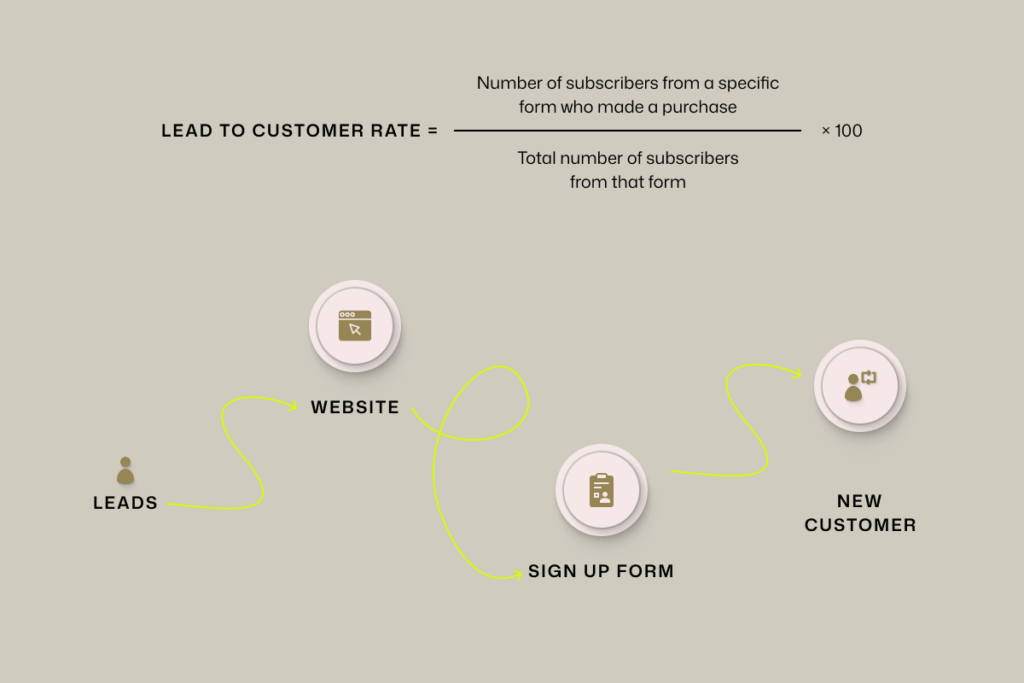
For example, if 1,000 people subscribed through your homepage pop-up, and 87 of them made a purchase within 30 days, your Lead to Customer Rate for that form is 8.7%.
Track this per form, per incentive, and per traffic source. You will quickly see which combinations produce buyers versus which ones just inflate your subscriber count.
2. One-Time to Repeat Customer Rate
If Lead to Customer Rate tells you whether your acquisition is working, this metric tells you whether your retention is working, and retention is the whole point of email marketing.
Acquiring a new customer costs 5 to 7 times more than selling to an existing one. Every time a one-time buyer comes back for a second purchase, you are generating revenue without paying for another click, another ad, another influencer post. Increasing the LTV of customers you already have is the most cost-efficient growth lever available, and this metric tells you exactly how well you are pulling it.
We genuinely believe that by 2027, brands without strong retention marketing will struggle to scale. Paid media costs are climbing. Shipping and production costs are not coming down. If you are relying on new customer acquisition to drive all of your growth, the math is going to get tighter and tighter. The brands that figure out how to bring existing customers back are the ones that will win.
How to measure it:
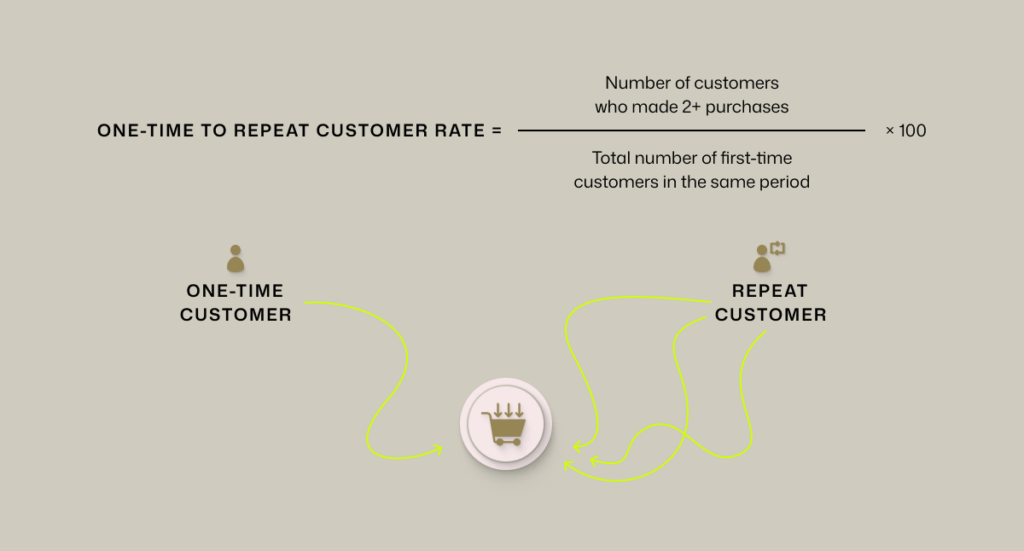
For example, if 500 customers made their first purchase today, and 165 of them came back and purchased again within the next 90 days, your rate is 33%.
Set a benchmark, track it monthly, and build your email strategy around moving this number up.
3. Average Time Between Orders
Once you know that customers are coming back, your next question should be: how fast? Can you shorten the gap between purchases?
Average Time Between Orders is a metric that does not get nearly enough attention, but it has a massive compounding effect on revenue. If your average customer buys every 90 days and you can move that to 75 days, you are adding an extra purchase cycle per customer per year. At scale, that is significant, not just in revenue, but in the depth of the relationship you are building.
Reducing this time is not just about sending more emails. It is about creating a communication strategy that makes your brand the obvious first choice when a need arises. That means your post-purchase emails need to educate, your customer service needs to deliver, your packaging experience needs to make an impression, and your product breadth needs to give them a reason to stay in your ecosystem.
This is actually one of the core things we dig into at Retention Side – identifying exactly why customers are waiting as long as they are before coming back, and building a roadmap to close that gap.
How to measure it:
Take all customers who have placed more than one order. For each customer, calculate the number of days between consecutive orders. Average those time gaps across your entire customer base. Shopify Analytics and other analytics tools made this easy for you.
4. Average Order Value (AOV)
AOV is one of those metrics that sounds straightforward, but when you start understanding its relationship with email marketing specifically, it opens up a lot of opportunities.
Email is one of the most effective channels for increasing AOV because of the format itself. Each email is essentially a mini landing page, you have space to tell a story, explain the value of buying more, show complementary products, and make bundling feel like the obvious choice. Whether you are selling supplements, fashion, home goods, or anything else, there is almost always a bundling or upsell story to tell through email.
How to measure AOV in Shopify:
Go to Analytics > Reports > Sales by channel or use the built-in Overview dashboard. Your AOV is displayed as a standard metric. For email-specific AOV, you will want to filter orders that came through email attribution in Klaviyo and cross-reference with Shopify order data.

5. Units Per Transaction (UPT)
Units Per Transaction is AOV’s close cousin, but it gives you a different and equally valuable layer of insight. Where AOV tells you the dollar value of each order, UPT tells you how many products are in that order, and that distinction matters a lot for retention strategy.
When a customer buys multiple products in a single transaction, two important things happen. First, the order value goes up. Second, and more importantly, they are now exposed to more of what you make. That broader exposure increases the chance they find a second product they love, which increases the chance they come back, which shortens the time between orders. It is a flywheel, and email is one of the best tools for getting it spinning.
Ask yourself: what can you do to get customers to add one more item to their cart? Is it product education in your emails? Bundle offers with a small discount? Scarcity messaging on a complementary product? There is no universal answer, it takes testing, but moving UPT up by even 0.2 units per transaction can have a real impact at volume.
How to measure Units Per Transaction in Shopify:
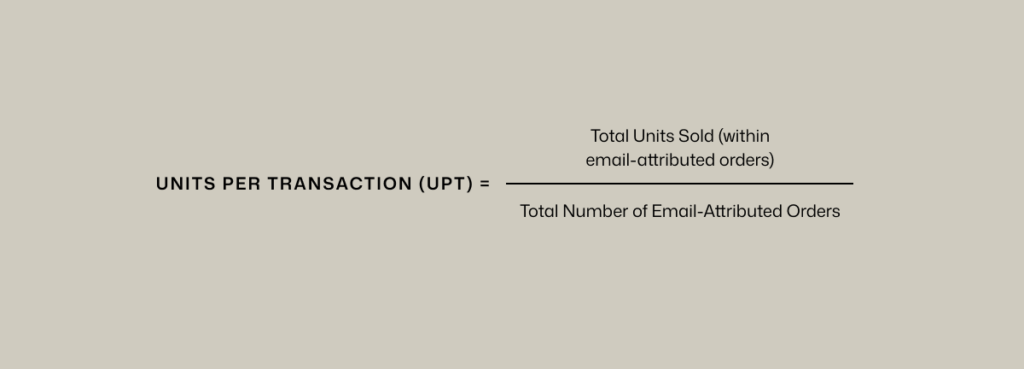
You can pull this from Shopify’s Product Analytics section or through a custom report filtering by sales channel.
Pro tip
Do not just read these metrics and forget about them. Create a simple Google Sheets tracker where you log all five metrics every two weeks. Set up columns for each metric, a column for your quarterly KPI target, and a column that automatically flags whether you are trending up, down, or flat.
Your sheet should have a row for each bi-weekly period, with cells covering:
- Lead to Customer Rate (per active form)
- One-Time to Repeat Customer Rate
- Avg Time Between Orders (in days)
- Average Order Value (email-attributed)
- Units Per Transaction (email-attributed)
At the start of each quarter, set targets for where you want each metric to be by quarter-end. Check in every two weeks. This cadence gives you enough data to see trends without overreacting to week-to-week noise.
Conclusion: Measure what drives revenue, not what looks good
Here is the bottom line: email marketing is one of the most powerful tools in an eCom brand’s arsenal, but only if you are pointing it in the right direction. Open rates and submit rates make for nice dashboard screenshots, but Lead to Customer Rate, One-Time to Repeat Customer Rate, Average Time Between Orders, AOV, and Units Per Transaction are the numbers that will actually tell you whether your program is working and where to push next.
Our research consistently shows that brands who shift their measurement framework from vanity metrics to these retention-focused KPIs see clearer strategic direction, smarter resource allocation, and better outcomes.
The channel is not just about sending emails. It is about building a system that turns strangers into subscribers, subscribers into customers, and customers into loyal repeat buyers. That only happens when you are measuring what actually matters.
If you struggle with setting up those KPIs for your brand, you can hire an Email Marketing Agency, such as Retention Side, to help you with the thinking process and implementation.