

Most “retention case studies” you find online are marketing collateral dressed up as evidence. A vendor shows you a 40% lift in open rates, never mentions revenue, never mentions the starting baseline, and calls it a win. That’s not analysis. That’s a highlight reel with the context removed.
Operators running brands at $300k a month and above don’t have time for highlight reels. You need to know what actually changed, what it cost, what the before-state looked like, and whether the mechanism is something you could rebuild inside your own Klaviyo account. So this piece does something different: it walks through three documented retention case studies with real, verifiable numbers, and extracts the operating principle behind each one.
The economic case for retention isn’t new. Bain & Company’s foundational research, later published in Harvard Business Review, found that a 5% increase in customer retention increases profits by 25% to 95%, depending on the industry. That statistic gets quoted constantly, usually without the caveat that matters most: it’s a ceiling, not a floor. The same research found that acquiring customers online costs 20% to 30% more than acquiring them offline, and that new ecommerce customers often stay unprofitable for two to three years. Retention isn’t a nice-to-have layered on top of acquisition. For most DTC brands, it’s the only path to actual profitability.
What you’ll find in this breakdown
This article isn’t a tour of vendor logos. It’s a working framework for reading retention case studies the way an operator should:
- What separates a credible case study from a cherry-picked one
- Three real cases (OSEA Malibu, CALECIM, Mulmul) with the metrics that matter and the mechanism behind them
- How to read those results against actual category benchmarks, not blended averages
- The flow-versus-campaign revenue split that shows up underneath every case study here
- The specific principles a $300k+/month brand can pull from each case and put into its own lifecycle system
What a real retention case study looks like
Before breaking down any case, it’s worth being precise about what makes a case study trustworthy in the first place. Most don’t survive this filter.
A credible retention case study has four characteristics. First, it names a real brand, or at minimum an anonymized brand with a verifiable industry, revenue range, and timeframe, not a vague “leading DTC company.” Second, it reports before-and-after metrics tied to revenue or purchase behavior, not just engagement proxies like open rate or click rate. Third, it describes a system-level change, meaning a shift in architecture, segmentation logic, or channel strategy, not a claim that they simply “sent more emails” or “wrote better subject lines.” Fourth, it specifies a timeframe, because a 20% lift over six months means something completely different from a 20% lift over three years.
Vendor case studies routinely fail this test by reporting the single best metric out of a dozen tracked, omitting the baseline, or compressing an 18-month rollout into language that implies it happened in a single campaign. That doesn’t make the underlying result fake. It makes it incomplete, and incomplete data is dangerous to build a strategy on. The three cases below hold up reasonably well against this filter, which is why they’re worth your attention.
The loyalty program case: OSEA Malibu
OSEA Malibu is a 25-plus-year-old clean beauty brand that, remarkably, had never run a loyalty program until it launched “Sea Rewards” on the Rivo loyalty platform. That gap alone is instructive. A brand can build meaningful repeat business through product quality and email alone for years, and still leave a substantial amount of retained revenue on the table by not formalizing the mechanics of loyalty.
The results after launch were significant. Customers who redeemed loyalty rewards had an average order value of $167, roughly 40% higher than the site-wide AOV. Redeemers hit a 77% repeat purchase rate. Customers who redeemed rewards generated 5.5 times more orders than those who didn’t engage with the program. Subscriber-tier members, meaning customers enrolled in both the loyalty program and a subscription option through Loop Subscriptions, showed 3.0 times higher purchase frequency and 5.1 times more repeat purchases than non-tier customers. Average customer lifespan rose from 365 days in Q4 2024 to 390 days by Q2 2025, and loyalty was directly attributed to a 13% share of revenue.
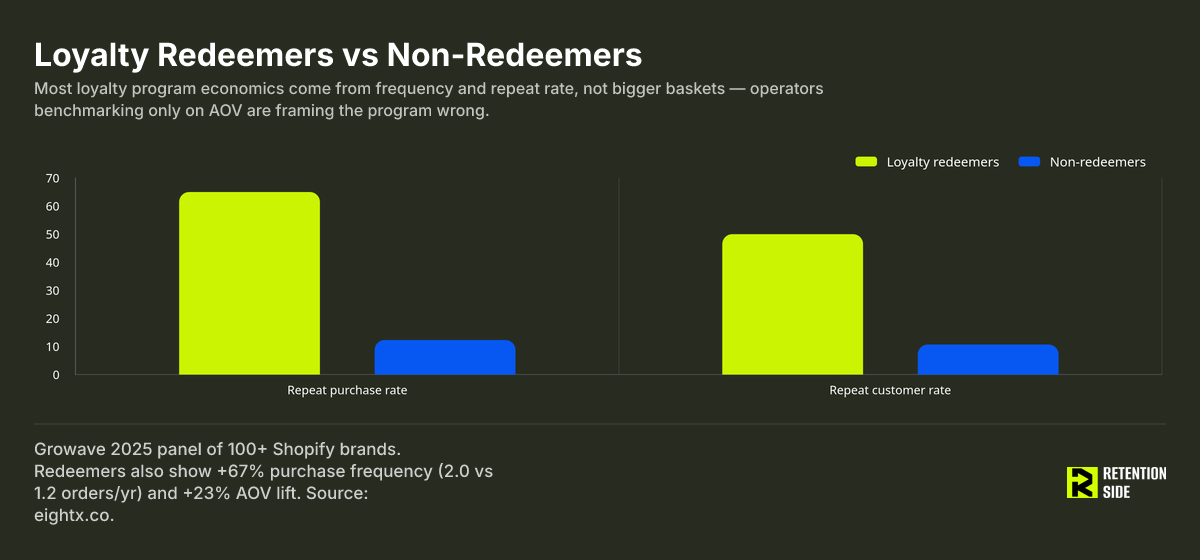
The mechanism worth studying here is tier structure. A flat points program, where every dollar spent earns the same reward regardless of status, doesn’t produce this kind of AOV lift on its own. What drives the 40% AOV gap is tier mechanics: giving customers a status to protect or climb toward changes basket-building behavior. Layering subscription status into the tier logic is the more advanced move. It turns a recurring purchase commitment into a status signal, which reinforces both the subscription and the loyalty program simultaneously instead of treating them as separate systems competing for the same customer attention.
The data-driven reactivation case: CALECIM
CALECIM, a premium Singapore-based skincare and haircare brand, faced a problem that will sound familiar to a lot of operators: 75% of its 14,000-customer database was inactive or lapsed. That’s not a list-hygiene issue you fix with a single win-back campaign. That’s a structural signal that the lifecycle system wasn’t built to keep customers engaged past a first or second purchase.
Using Lexer’s customer data platform, CALECIM rebuilt its approach around three moves: data-driven promotional targeting instead of blanket discounts, persona-based email marketing segmented by customer behavior and preference rather than recency alone, and AI-assisted one-to-one VIP messaging for its highest-value segment. The results: a 31% year-over-year increase in repeat purchase rate, a 16.8% lift in month-on-month conversion from persona-led campaigns specifically, and a 5.89% conversion rate from the VIP messaging program sent to 1,852 customers, generating $16.57 in revenue per email sent.
The transferable principle is sequencing, not tactics. CALECIM didn’t fix a 75% lapse rate by discounting harder. It fixed it by building the data infrastructure required to know which lapsed customers were worth targeting with what message, and only then layering in personalization. Reactivation campaigns built on batch-and-blast segmentation routinely underperform because they treat every lapsed customer identically. Persona-based targeting outperforms because it acknowledges that a customer who lapsed after one purchase and a customer who lapsed after ten purchases need entirely different messages, offers, and urgency levels.
The lifecycle automation case: Mulmul
Mulmul, an Indian ethnic wear brand, moved from fragmented, campaign-led outreach to a unified lifecycle automation system spanning WhatsApp, email, SMS, and RCS, built on Netcore’s automation platform. The headline metrics: repeat purchase rate rose from 24% to 28%, a relative increase of 17%. Lifecycle journeys, meaning behavior-triggered flows rather than manual sends, doubled their share of total revenue contribution from 2% to 4%. Overall engagement rose 143%, WhatsApp-driven revenue rose 676%, and email revenue rose 218%.
Two things stand out. The first is the size of the relative shift against a modest absolute base. A move from 2% to 4% of revenue sounds small until you recognize it’s a full doubling of the lifecycle channel’s contribution, achieved not by adding more channels but by connecting the channels that already existed into a single coordinated system. The second is the repeat purchase rate context: 24% starting and 28% ending both sit below the typical 25% to 40% range for beauty and apparel-adjacent categories, which tells you Mulmul had real structural room to close before this initiative, and that the gain, while real, likely still leaves upside on the table.
The operating principle here is that the system change matters more than any single flow. Mulmul didn’t win by building one exceptional automation. It won by connecting previously siloed channels into a coordinated lifecycle engine where a customer’s behavior in one channel triggered a relevant next action in another. That’s a fundamentally different architecture than four separate teams running four separate campaign calendars.
Reading the results against real benchmarks
Case study percentages mean nothing without a category baseline, and this is where a lot of retention reporting goes wrong. A 31% year-over-year increase sounds impressive in isolation, but you need to know what “good” looks like in that specific vertical before you can judge it properly.
Repeat purchase rate benchmarks vary enormously by product category. Consumables like coffee, supplements, and pet food typically run 30% to 50% at the 365-day mark. Beauty and personal care sits at 25% to 40%. Food and beverage lands in a similar 25% to 40% band. Apparel and accessories run lower, at 20% to 30%. Home and lifestyle products sit at 15% to 25%, and one-off durable goods, where repeat purchase isn’t even the natural behavior, run as low as 5% to 15%. Shopify’s own retention data puts the blended ecommerce average repeat customer rate at 28.2%, with CBD leading at 36.2% and tea products trailing at 20.9%.
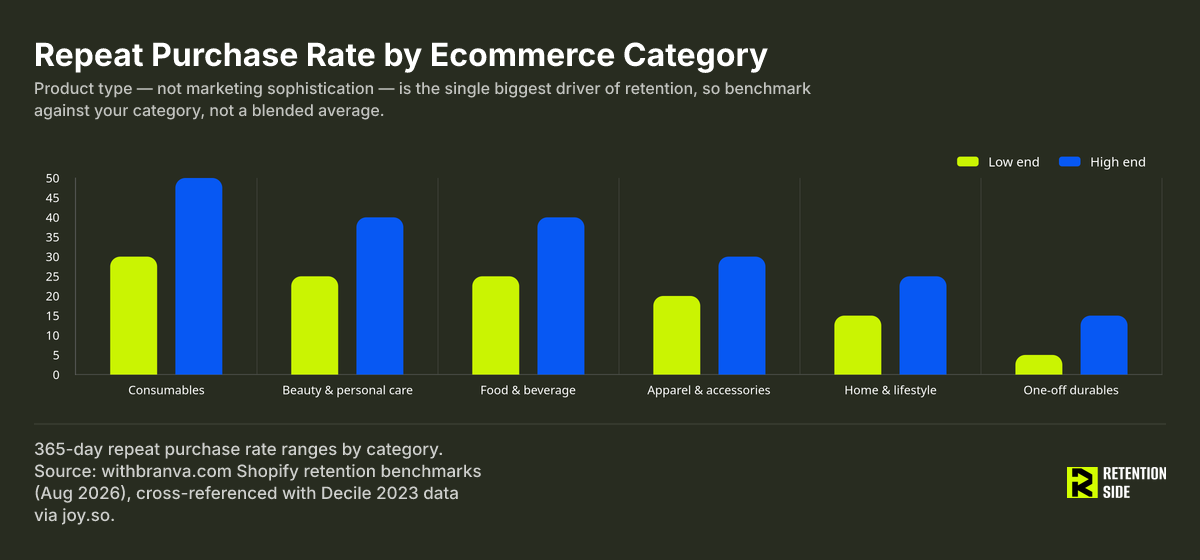
Against that framework, Mulmul’s 24% starting point in apparel-adjacent ethnic wear sits at the low end of its category range, and its 28% ending point is still only mid-range, not exceptional. That doesn’t diminish the case study. It clarifies what the win actually represents: closing a real structural gap rather than optimizing an already-strong baseline. OSEA’s 77% redeemer repeat purchase rate looks extraordinary next to any category average, but remember that figure describes redeemers specifically, a self-selected group of already-engaged customers, not the brand’s full customer base.
There’s a broader concentration pattern worth internalizing here too. Smile.io’s 2025 loyalty report, built on 585 million orders across more than 100,000 merchants, found that the top 5% of customers generate 35% of total store revenue, and that loyal customers overall, just 21% of the customer base, account for 44% of revenue and 46% of orders. Every case study in this article is, in different ways, a story about identifying and deepening engagement with that concentrated top segment rather than trying to move the entire customer base equally.
The flow revenue gap underneath every case
Strip away the specific tools, brands, and industries in these three cases, and one pattern repeats across all of them: every improvement came from replacing broadcast communication with behavior-triggered, intent-based communication. CALECIM moved from batch email to persona-based segmentation. Mulmul moved from campaign-led outreach to lifecycle automation. OSEA layered tier-based triggers on top of a subscription and loyalty structure. None of these are coincidences.
Klaviyo’s 2026 benchmark data, drawn from more than 183,000 brands, quantifies exactly why this pattern holds. Automated flows account for only 5.3% of total email sends but generate 41% of total email revenue. Revenue per recipient for flows sits at $1.94 compared to $0.11 for campaigns, an 18x gap. Flow click rates run roughly three times higher than campaign click rates, 5.58% versus 1.69%. Flows also disproportionately convert new buyers: 48% of flow revenue comes from first-time customers, compared to just 16% for campaigns.
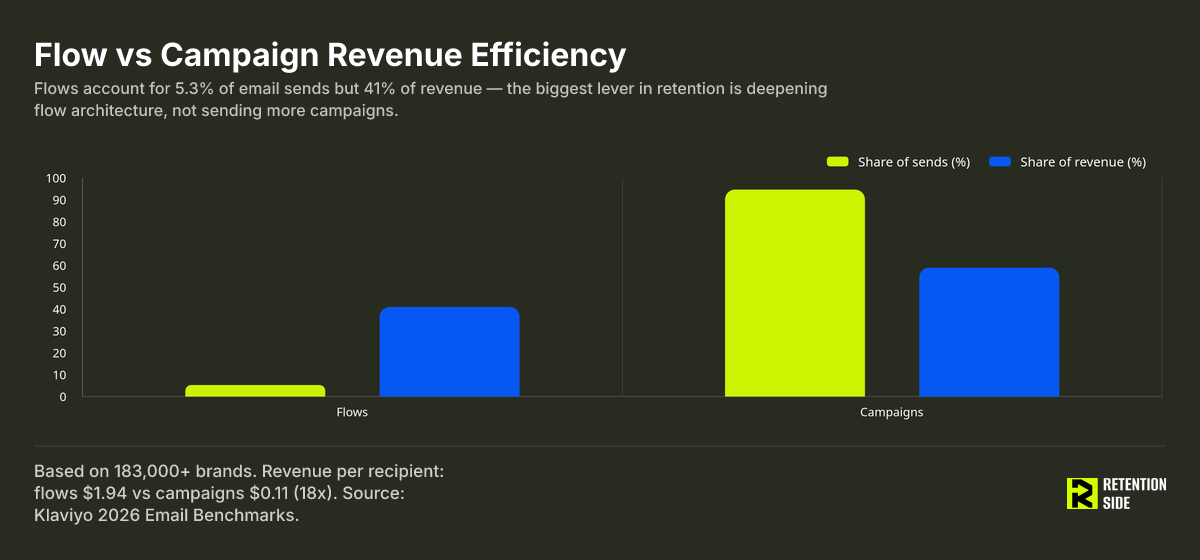
That flow-revenue share isn’t static across brand size either. Brands under $5 million in annual revenue typically see 25% to 35% of email revenue coming from flows. Brands in the $5 million to $20 million range see 40% to 50%. Brands above $20 million see 50% to 60%, with top performers reaching 58% to 65%. For a brand doing $300k a month, roughly $3.6 million a year, the realistic target sits at the top of that first band or the low end of the second: somewhere around 35% to 45% of email revenue coming from flows, not campaigns.
This is also where the diagnostic pattern we see most often at Retention Side becomes relevant. When a brand’s lifetime value is flat despite consistent send volume, three things are almost always worth checking first: whether the lifecycle has structural gaps, meaning flows that simply don’t exist yet for major customer journey stages; whether win-back timing is calibrated to actual purchase interval data or just copied from a template; and whether campaign strategy has quietly conditioned the list to wait for discounts before buying. On that second point specifically, most brands we look at have their win-back trigger set two to three times later than the data actually supports, which means the flow fires well after the customer has already mentally moved on. Recalibrating that single trigger is frequently the highest-leverage change available, more impactful than adding an entirely new flow.
A properly built post-purchase sequence reinforces this same logic. A five-email structure spanning purchase reinforcement on day zero to one, product education around day two to five, replenishment or cross-sell prompts around day seven to ten, a review request around day fourteen to twenty-one, and a second-purchase bridge around day eighteen to twenty-five, with separate paths for first-time versus returning buyers, is the kind of structural coverage that turns a single transaction into the start of a lifecycle rather than the end of one.
What $300k+/month brands should actually take from this
Pulling the threads together, five principles show up consistently enough across these cases to be worth building into your own system rather than treating as one-off tactics.
Tier mechanics outperform flat points for AOV impact. OSEA’s 40% AOV lift among redeemers didn’t come from giving points away. It came from giving customers a status worth protecting, and layering subscription commitment into that status structure.
Data infrastructure has to come before reactivation tactics, not after. CALECIM’s 31% repeat purchase increase started with understanding who the 75% of lapsed customers actually were before sending them anything, not with a more aggressive discount.
Lifecycle-led systems beat campaign-led systems on revenue contribution, even when the absolute numbers start small. Mulmul’s doubling from 2% to 4% of revenue is a smaller number than it sounds, but the direction and mechanism are exactly right, and that mechanism scales.
Win-back timing should be calibrated against your actual purchase interval data, not against a generic 60- or 90-day template. If you haven’t checked this in the last two quarters, it’s very likely set too late.
The post-purchase sequence needs full structural coverage, from immediate reinforcement through the second-purchase bridge, with separate logic for first-time and returning buyers. A single “thanks for your order” email is not a post-purchase flow.
If you want a deeper walkthrough of the retention channel mix, loyalty structure, or lifetime value math referenced throughout this piece, those are subjects we’ve already covered in detail elsewhere on Retention Side.
The pattern behind the numbers
Every case study broken down here used different tools, different verticals, and different starting points, but the architecture underneath was identical: lifecycle mapping instead of a single loyalty gimmick, intent-based triggers instead of calendar-based campaigns, tiered segmentation instead of one-size-fits-all messaging, and timing calibrated to real customer behavior instead of industry defaults.
That’s the real takeaway for an operator evaluating any retention case study, including these three. The specific platform or campaign that produced the headline number is almost never the reason it worked. The reason it worked is that retention was treated as a system with deliberate architecture, not a channel you occasionally remember to use. Build that system first, and the specific tactics you borrow from cases like these will actually have somewhere to land.