


Most brands find out their retention strategy is broken the hard way: a quarter where revenue flattens, ad costs climb, and nobody can explain why the customers who used to come back stopped showing up. By the time it shows up on the P&L, the problem has usually existed for months.
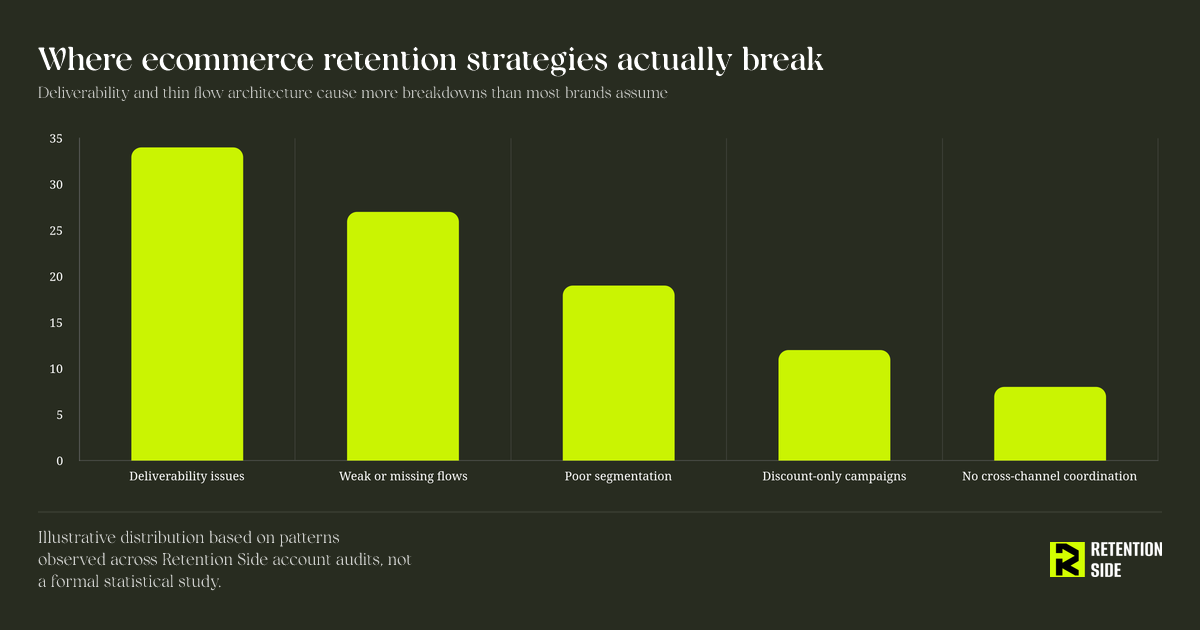
The frustrating part is that retention rarely fails all at once. It erodes quietly, one skipped test, one ignored flow, one deliverability dip at a time, until the brand is running what looks like a retention program but functions more like a list of disconnected tactics. We see this constantly working inside Klaviyo accounts for $300K+/month DTC brands: the welcome flow is still live, campaigns still go out, but nothing is actually compounding.
This article breaks down the specific, observable signs that tell you a retention strategy has broken down, why each one happens, and what to actually do about it. This isn’t a generic checklist. It’s a diagnostic built from what we see repeatedly when we audit accounts that “used to work fine.”
Key takeaways
- A broken retention strategy rarely announces itself. It shows up as a slow decline in repeat purchase rate, rising unsubscribe and spam complaint rates, and flows that quietly stop converting the way they used to.
- Deliverability problems are one of the most common and least diagnosed causes. If your emails aren’t landing in the inbox, every other retention metric downstream is compromised, whether you notice it or not.
- Over-reliance on discount campaigns is a symptom of a deeper issue: a lack of segmentation and a missing content strategy for non-promotional communication.
- Flows that were built once and never revisited are a near-universal failure point. Customer behavior changes; flows that don’t get re-tested fall out of sync with it.
- Not every retention dip is a retention problem. Acquisition quality, website conversion, and product experience all feed into retention performance, and a good diagnosis starts by ruling those out.
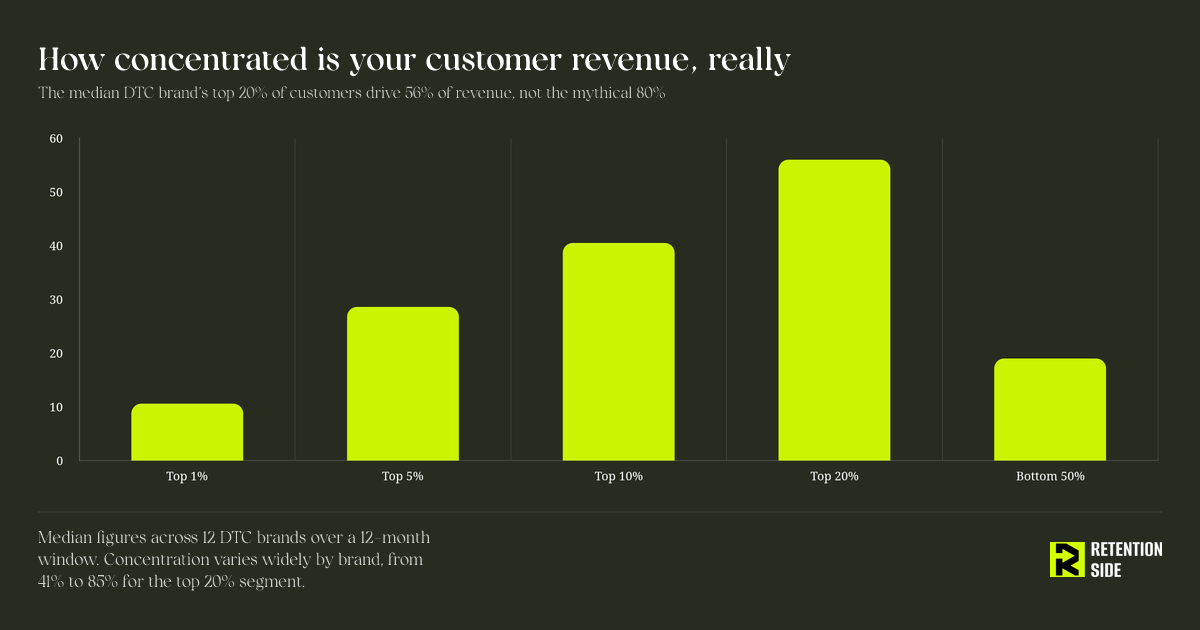
- The Pareto principle (80/20 rule) is a useful mental model for prioritizing where to look first, but real DTC data shows concentration is usually closer to 50-60% from the top 20% of customers, not a flat 80%.
What we’ll cover
- Why “broken” rarely means “everything stopped working”
- Sign 1: Repeat purchase rate has quietly stalled or declined
- Sign 2: Deliverability has degraded without anyone noticing
- Sign 3: Campaigns are carrying the whole program, and they’re mostly discounts
- Sign 4: Flows haven’t been touched since they were built
- Sign 5: List growth looks fine, but lead quality has dropped
- Sign 6: Segmentation exists on paper but isn’t actually driving decisions
- How to tell if it’s really retention, or something upstream
- Applying the 80/20 rule to diagnose where to focus first
- FAQs
- Conclusion
Why “broken” rarely means “everything stopped working”
When a founder or Marketing Director tells us their retention strategy is broken, they usually mean revenue from existing customers has plateaued or dropped. But when we look under the hood, it’s almost never that every part of the program failed simultaneously. It’s usually one or two structural weaknesses that have been quietly dragging down performance for a long time, masked by decent top-line numbers from ongoing acquisition spend.
That distinction matters because it changes how you diagnose the problem. If you assume everything is broken, you’ll rebuild things that were actually working fine and waste time. If you can pinpoint the actual failure points, whether it’s deliverability, flow design, segmentation, or an over-dependence on discounting, you fix the thing that’s actually costing you money and leave the rest alone.
Retention is a system, not a single lever. When one part of that system degrades, it doesn’t always show up where you’d expect. A deliverability problem shows up as lower campaign revenue, not as a deliverability metric anyone is watching. A missing flow shows up as lower average order value from repeat customers, not as an obvious gap in the flow list. Diagnosing a broken retention strategy means knowing where to look, not just staring at top-line revenue and guessing. If you’re not sure what healthy revenue contribution even looks like, our breakdown of how much revenue ecommerce email should generate gives you a realistic benchmark to compare against before you start tearing things apart.
Sign 1: Repeat purchase rate has quietly stalled or declined
Repeat purchase rate, sometimes called returning customer rate, is the single clearest signal of whether your retention system is functioning. If it’s flat or trending down over a rolling 90 to 180 day window, that’s the strongest evidence something structural has shifted.
The trap here is benchmarking against generic industry numbers. A repeat purchase rate that looks strong in furniture would be alarming in supplements or skincare, categories built around consumable products with natural repurchase cycles. Before you panic over a number, you need a category-appropriate baseline built from your own historical performance, not an average pulled from a blog post about your industry. For a structured framework on turning that baseline into action, our guide on how to increase repeat purchases on Shopify walks through the specific levers that move this metric, from post-purchase flows to replenishment timing.
What actually causes repeat purchase rate to slide:
- A first purchase experience that isn’t building enough trust or satisfaction to justify a second order
- Flows that used to nudge customers back into a second purchase, but haven’t been updated as the audience or product mix changed
- A shift in the type of customer being acquired, meaning the traffic coming in now converts to one-time buyers more than the customers acquired a year ago
- A pricing or promotional cadence that trained customers to wait for markdowns instead of buying at full price on their own schedule
If repeat purchase rate is the metric moving in the wrong direction, resist the urge to throw a blanket discount campaign at the problem. That treats a symptom, and it usually makes the underlying issue (a lack of genuine reasons to come back) worse over time by teaching your list that price is the reason to return, not the product or the brand relationship.
Sign 2: Deliverability has degraded without anyone noticing
This is the sign most brands miss entirely, because delivery and deliverability get treated as the same thing when they aren’t. Delivery means your email was technically accepted by the receiving server. Deliverability means it actually landed somewhere useful, the primary inbox, instead of getting filtered into spam or buried in the promotions tab where open intent drops sharply.
A brand can have a 99% delivery rate and still have a badly broken retention channel if half of that mail is landing in spam. Klaviyo’s dashboard will show you sends and a delivery percentage, but it won’t always make inbox placement obvious unless you’re actively monitoring spam complaint rate, unsubscribe rate by domain, and engagement trends segmented by mailbox provider like Gmail, Yahoo, and Outlook. If you’ve never run this kind of audit, our Klaviyo deliverability guide covers the full diagnostic, from authentication setup to list hygiene to sender reputation monitoring.
Signs your deliverability has quietly degraded:
- Open rates dropping across the board, especially concentrated in one mailbox provider rather than evenly across your list
- Spam complaint rate creeping above 0.1%, which is a threshold that gets you throttled by major mailbox providers. As of February 2024, Gmail and Yahoo’s sender requirements mandate that bulk senders keep reported spam rates below 0.3%, with 0.1% being the practical ceiling most email deliverability experts recommend treating as a red flag
- A growing gap between your most engaged segment’s performance and your list-wide performance, suggesting the list-wide numbers are being dragged down by inbox placement issues rather than genuine disengagement
- Recent list growth spikes (a big giveaway, a bulk import, an aggressive pop-up incentive) followed by a dip in overall engagement metrics
Deliverability problems compound because they’re invisible until they’re severe. A brand that ignores early warning signs for two or three months can end up needing a full sending domain reset, a slow re-warming period, and a real hit to campaign revenue in the meantime. Mailgun’s research on spam complaint rates notes that even 0.1% is considered high by most ESP standards, with some platforms setting their internal threshold as low as 0.08% — well below what Gmail formally enforces. If you haven’t looked specifically at inbox placement and complaint rate by domain in the last quarter, that’s worth doing before you touch anything else.
Sign 3: Campaigns are carrying the whole program, and they’re mostly discounts
Look at your last 90 days of campaign sends. If the majority are promotional and the rest of your calendar is thin, that’s a structural problem, not a content problem. Campaigns should represent a mix of promotional, educational, and value-driven communication built around real segments, not a rotating discount calendar sent to your entire list.
When subscribers only hear from a brand during sales, two things happen predictably. Engagement drops during non-promotional periods because there’s no reason to open, and full-price purchasing declines because you’ve trained your best customers to wait. This is one of the more common ways a retention strategy quietly breaks: it still generates revenue, so nobody flags it as broken, but the revenue is increasingly margin-negative and increasingly dependent on markdowns to move. If you want a framework for building a healthier mix, our promotional email strategy guide breaks down how to balance promotional, educational, and value-driven sends without defaulting to a discount calendar.
The fix isn’t “send fewer discounts.” It’s building a campaign calendar that reflects actual segmentation: VIP customers who don’t need a discount to buy, lapsing customers who might need one, new customers still building trust, and everyone in between. Campaign strategy depends on segmentation working in the first place, which is the next sign worth checking.
Sign 4: Flows haven’t been touched since they were built
Flows are behavior-based, time-sensitive automations, and they should map to specific customer journey stages and the specific reasons customers drop off at each one. The problem is that most brands build a standard flow set (welcome, abandoned cart, browse abandonment, post-purchase, win-back) once, early on, and never revisit them.
Flows are never finished. Customer behavior shifts as your product mix changes, as your acquisition channels shift, and as your average customer’s expectations evolve. A win-back flow written two years ago for a smaller, more price-sensitive audience might be completely misaligned with the customer you’re acquiring today. An abandoned cart flow with static copy and a single discount tier stops performing as your AOV grows and your customer base matures. According to Klaviyo’s own flow audit checklist, top-performing flows convert around 3x more recipients than average flows, and the gap almost always comes down to optimization cadence — not the original flow logic itself.
Ask yourself honestly: when was the last time you A/B tested subject lines, send timing, or incentive structure inside your core flows? If the answer is “not in the last six months,” that’s very likely part of why performance has plateaued. It’s not that the flow logic is fundamentally wrong. It’s that flows built once and left untouched drift out of sync with actual customer behavior, and that drift is invisible unless you’re actively testing. Klaviyo Academy’s flow best practices recommend A/B testing timing and content within flows using conditional splits, and treating flow structure as something that evolves with your brand rather than a one-time setup. For a deeper system-level approach, our Klaviyo flow optimization strategies walk through how to audit, re-test, and restructure flows that have gone stale.
It’s also worth checking whether you have flows that exist purely to generate revenue and nothing else. Not every flow needs to sell. Some flows should exist to educate new customers on how to use a product, collect zero-party data about preferences, remind customers about replenishment timing, or simply improve the post-purchase experience. A retention architecture built entirely around direct-response flows misses a lot of the lifecycle value that comes from a customer simply having a better experience with the brand. For example, a well-built win-back strategy isn’t just a discount email — it’s a graduated series that tests different message angles before resorting to price incentives.
Sign 5: List growth looks fine, but lead quality has dropped
List growth is one of the most misleading vanity metrics in retention marketing. A form submission rate going up looks great in a monthly report. It says nothing about whether those new subscribers ever become customers.
The real KPI is lead-to-customer rate, not form submission rate. If your list is growing 20% quarter over quarter but your lead-to-customer conversion has dropped by a comparable amount, you haven’t actually grown your customer base. You’ve grown a list of names that dilute your engagement metrics and drag down your sender reputation with mailbox providers who track how recipients interact with your mail. Our ecommerce email list growth strategies go deeper into how to grow your list without sacrificing subscriber quality, including how to calibrate incentives and what to track instead of raw form fills.
This usually traces back to an incentive that’s too aggressive relative to what it costs to convert that subscriber into a paying customer. A 20% off code might spike form fills, but if it’s attracting deal-seekers who unsubscribe the moment the discount period ends, you’ve traded short-term list growth for long-term deliverability and margin damage. The incentive should be calibrated to balance conversion lift against margin protection, not maximized for the biggest possible spike in subscriber count.
Sign 6: Segmentation exists on paper but isn’t actually driving decisions
Plenty of brands have segments built in Klaviyo. VIPs, lapsed customers, engaged non-purchasers, first-time buyers. The question is whether those segments actually determine who receives what, or whether campaigns still go out to “everyone” with segments used only for the occasional special send.
Segmentation is the connective thread that makes campaigns and flows work together as a system instead of as parallel, uncoordinated efforts. If your VIP segment gets the same cadence and the same offers as your general list, you’re not really segmenting, you’re just labeling. Real segmentation shows up in decisions: different send frequency for different engagement tiers, different incentive levels for different purchase histories, different messaging tone for new customers versus loyal repeat buyers. Our Shopify email segmentation strategy guide breaks down how to build segments that actually drive these kinds of decisions, not just sit in a sidebar unused.
When segmentation is superficial, it usually correlates with several of the other signs on this list. Discount-heavy campaigns happen because there’s no differentiated strategy for high-value customers. Flows underperform because they’re built for an average customer that doesn’t really exist. Fixing segmentation often has a multiplying effect on everything else in the retention system, because it’s the mechanism that lets every other channel and campaign actually target the right person with the right message.
How to tell if it’s really retention, or something upstream
Before you conclude your retention strategy is the problem, rule out everything that feeds into it. Retention doesn’t operate in isolation. It depends on acquisition quality, website conversion quality, customer behavior shifts, and consistency across channels.
A few questions worth running through before you touch your Klaviyo account:
- Has your acquisition mix shifted toward channels or campaigns that bring in lower-intent traffic? A shift from organic and referral toward broad-match paid social can quietly change the quality of customer you’re retaining, and no amount of flow optimization fixes an acquisition quality problem.
- Has anything changed on the website that affects post-purchase experience, like shipping times, return policy visibility, or checkout friction? A worse purchase experience upstream will show up downstream as lower repeat rates, and it will look like a retention failure even though the root cause sits in a completely different part of the business.
- Has your product assortment changed in a way that reduces natural repurchase reasons? A brand that used to sell consumable products and recently expanded into one-time-purchase categories will see repeat rate metrics decline for reasons that have nothing to do with email or SMS execution.
- Is the drop isolated to specific segments or channels, or is it broad-based across the entire customer base? A broad-based decline points toward something structural (acquisition, product, or site), while an isolated decline in one flow or segment points more specifically at retention execution.
Ruling these out first saves you from rebuilding a retention program that was never actually the source of the problem. We’ve walked into accounts where the team was convinced their email program was failing, when the real issue was a site redesign that quietly broke a key upsell placement three months earlier.
Applying the 80/20 rule to diagnose where to focus first
What is the 80/20 rule in ecommerce?
The 80/20 rule, or Pareto principle, applied to ecommerce is the observation that a disproportionate share of revenue, profit, or impact tends to come from a small share of inputs, whether that’s customers, products, or marketing campaigns. In practice, it shows up as a small number of SKUs generating most of your revenue, a small number of customers generating most of your profit, and a small number of campaigns or creatives driving most of your conversions.
The number “80/20” is a mental shorthand more than a precise ratio. Real data across a range of DTC brands typically shows the top 20% of customers generating somewhere between 41% and 85% of revenue, depending on the brand’s category and business model, with a median closer to 56%. High-AOV, lower-frequency categories like luxury goods or premium spirits tend to skew more concentrated, while high-frequency, lower-AOV categories tend to be more evenly distributed. The exact ratio matters less than the underlying principle: your revenue and profit are not evenly distributed across your customer base, and treating every customer the same is a retention strategy design flaw. Research from the Ehrenberg-Bass Institute for Marketing Science confirms this, finding that the real Pareto ratio in marketing is closer to 60/20 — meaning the bottom 80% of buyers still contribute roughly 40% of sales, which is far more than the classic 80/20 framing suggests. A separate study published in Marketing Letters found an average Pareto ratio of 0.67 across 339 publicly traded companies, with non-subscription businesses skewing higher than subscription ones.
What is the 80/20 rule in customer retention?
Applied specifically to retention, the 80/20 rule means your highest-value, most loyal customers deserve a disproportionate share of your attention, personalization, and retention investment relative to your one-time or low-frequency buyers. This doesn’t mean ignoring the rest of your list. It means recognizing that a generic, one-size-fits-all retention program underserves your best customers (who could be worth significantly more with tailored attention) and overspends effort on customers who were never going to become repeat buyers regardless of what you send them.
In practice, this shows up as VIP segments with dedicated flows and campaigns, early access programs for top-tier customers, and loyalty tiers that reward the behaviors that correlate with long-term value: purchase frequency, total spend, and tenure. A well-structured loyalty program strategy operationalizes this by building tiers and rewards that disproportionately serve your top cohort, rather than spreading benefits evenly across customers who contribute very different amounts of revenue. It also shows up in how you diagnose a broken retention strategy. If your top 20% of customers are still engaging and purchasing normally while your broader list has gone quiet, that’s a very different problem than if engagement has dropped across every segment including your best customers. The former points to acquisition or list quality issues further down the funnel; the latter points to something more fundamentally broken in how you’re communicating with your best customers.
How to improve ecommerce customer retention
Once you’ve identified where the actual breakdown is happening, the fix usually falls into one of these categories. Nine practical moves worth prioritizing:
- Audit deliverability first, before anything else. Check spam complaint rate, inbox placement, and engagement trends segmented by mailbox provider. If deliverability is compromised, every other fix will underperform until it’s resolved.
- Rebuild your flow map around actual customer journey stages, not a generic template. Map the specific reasons customers drop off at each stage and build or revise flows to address those specific moments.
- Re-test your core flows on a quarterly cadence. Subject lines, send timing, incentive structure, and content should all be treated as live tests, not settled decisions from two years ago.
- Shift your campaign calendar toward a real mix of promotional, educational, and value-driven sends, and stop leaning on your entire list for every discount.
- Fix segmentation so it actually drives decisions, not just labels. Different frequency, different offers, and different tone for different tiers of engagement and value.
- Recalibrate your incentive strategy so it’s built to convert quality leads, not just maximize form fills. Track lead-to-customer rate, not form submission rate, as your real KPI.
- Build or refine a loyalty structure that rewards your top 20% disproportionately, since they’re carrying a disproportionate share of your revenue.
- Expand your channel mix deliberately, adding SMS, push, direct mail, or WhatsApp based on actual audience behavior and communication preference, not just because a competitor is doing it.
- Separate retention diagnosis from acquisition and site diagnosis. Before concluding retention is broken, confirm the traffic quality, conversion rate, and product experience haven’t shifted upstream.
This is the kind of system-level thinking we build into every account at Retention Side. Klaviyo is usually the starting point, but a real retention system extends into the right combination of SMS, loyalty, direct mail, and other channels once the email foundation, deliverability, list quality, flows, and segmentation, is actually solid. If you’d like a deeper look at how those channels fit together, we’ve written about it directly in our piece on what channels make a good ecom retention strategy.
What are the top 3 retention issues for line employees?
This question comes up often enough in retention conversations that it’s worth addressing directly, even though it’s an HR and workforce topic rather than a customer marketing one. Quantum Workplace research on employee turnover identifies three recurring drivers behind regrettable turnover: a lack of career growth opportunity, pay that employees feel is not fair or competitive, and a lack of recognition or feeling undervalued for their contributions. Their data shows only a quarter of departing employees had a growth conversation in the three months before leaving, and fewer than 40% felt recognized for their work in that same window.
The parallel to customer retention is worth noting, even if the mechanics differ. In both cases, the person who leaves usually signals it well before they act, and in both cases, the organization or brand that only reacts after the fact (an exit interview, a win-back campaign) is already too late to prevent the loss. The proactive approach, in eCommerce terms, means watching for early behavioral signals like declining open rates, lengthening time between purchases, or reduced engagement with flows, and intervening before the customer disengages completely rather than after.
Conclusion
A broken ecommerce retention strategy rarely looks like an obvious failure. It looks like flat repeat purchase rate you’ve gotten used to, deliverability metrics nobody checks segment by segment, a campaign calendar that’s quietly become a discount calendar, and flows that were built once and never revisited. None of these individually tank a business. Together, they compound into a retention program that costs money to run and doesn’t actually build the recurring revenue base a real system should produce.
The fix starts with an honest audit, not a rebuild. Look at deliverability by mailbox provider, look at whether your flows have been touched in the last two quarters, look at whether your campaigns still lean almost entirely on discounts, and rule out acquisition and site issues before you assume the problem lives inside your retention channels. Retention is a system that compounds when every part is functioning and tested continuously. It’s also a system that quietly erodes when any single part is neglected for too long, and the brands that catch it early are the ones that treat retention as an ongoing discipline rather than something they set up once and left alone.
If you’re seeing several of these signs at once and aren’t sure where the actual break is, that’s usually the point where an outside audit, from a Klaviyo agency or a dedicated retention team, finds the specific structural issue faster than continuing to guess internally.