


Most home decor brands pull up a generic email marketing benchmark report, compare their numbers against the “all-industry average,” and walk away with the wrong conclusion. A furniture or wall art brand converting campaigns at 0.13% looks broken next to a food and beverage brand converting at 0.26%, until you account for the fact that nobody buys a sofa the way they buy a snack.
Home decor is a considered-purchase category with a long natural buying cycle. That single fact changes what “good” looks like across almost every metric that gets published in a benchmark report. This article walks through the 2026 benchmark data that actually applies to home decor, explains why some of the most-quoted numbers are misleading without category context, and gives you a framework for diagnosing your own program instead of chasing averages that were never built for a low-frequency, high-consideration product category.
What you’ll learn
- Where home decor sits in the 2026 Klaviyo benchmark data, and why it converts differently than other categories
- Which flow benchmarks matter most for a room-by-room, restock-driven catalog
- Why repeat purchase rate numbers change dramatically depending on the measurement window
- The deliverability floor that determines whether any of these benchmarks are even measuring something real
- How to diagnose underperformance without optimizing the wrong layer of the system
What email marketing benchmarks are, and why most published ones mislead
An email marketing benchmark is a reference point, usually an average or median pulled from a large dataset, that tells you what typical performance looks like for a metric like open rate, click rate, or placed order rate. Used correctly, benchmarks help you spot whether your program is underperforming, in line, or ahead of comparable brands.
Used incorrectly, they become a scoreboard that has nothing to do with your actual business. Two things distort most published benchmarks for home decor specifically.
The first is open rate inflation from Apple’s Mail Privacy Protection, which auto-opens emails for a large share of Apple Mail users regardless of whether a human ever looked at the message. This is why datasets that include a wide mix of email service providers, like MailerLite’s benchmark set, report noticeably higher open rates than Klaviyo’s DTC-only data, which filters out known bot activity. Neither number is “wrong,” they are measuring different populations with different methodologies, and blending them produces a figure that describes nothing real.
The second distortion is treating vanity metrics and outcome metrics as equally meaningful. Open rate tells you almost nothing about revenue impact anymore. Home decor email marketing benchmarks that matter are the ones tied to outcomes: placed order rate, flow conversion, repeat purchase rate measured with the correct window, and the deliverability indicators that determine whether your emails are even landing in front of a human being. Everything else is secondary context.
2026 email benchmarks by industry: where home decor sits
Klaviyo’s 2026 benchmark data, drawn from more than 183,000 brands, gives a clean picture of where Home & Garden sits relative to the all-industry average.
Campaign performance for Home & Garden: open rate 32.5% versus an all-industry average of 31%, click rate 1.78% versus 1.69%, and placed order rate 0.13% versus 0.16%. Flow performance: open rate 34.2% versus 32.2%, click rate 5.96% versus 5.58%, and flow placed order rate 2.12% versus 2.11%.
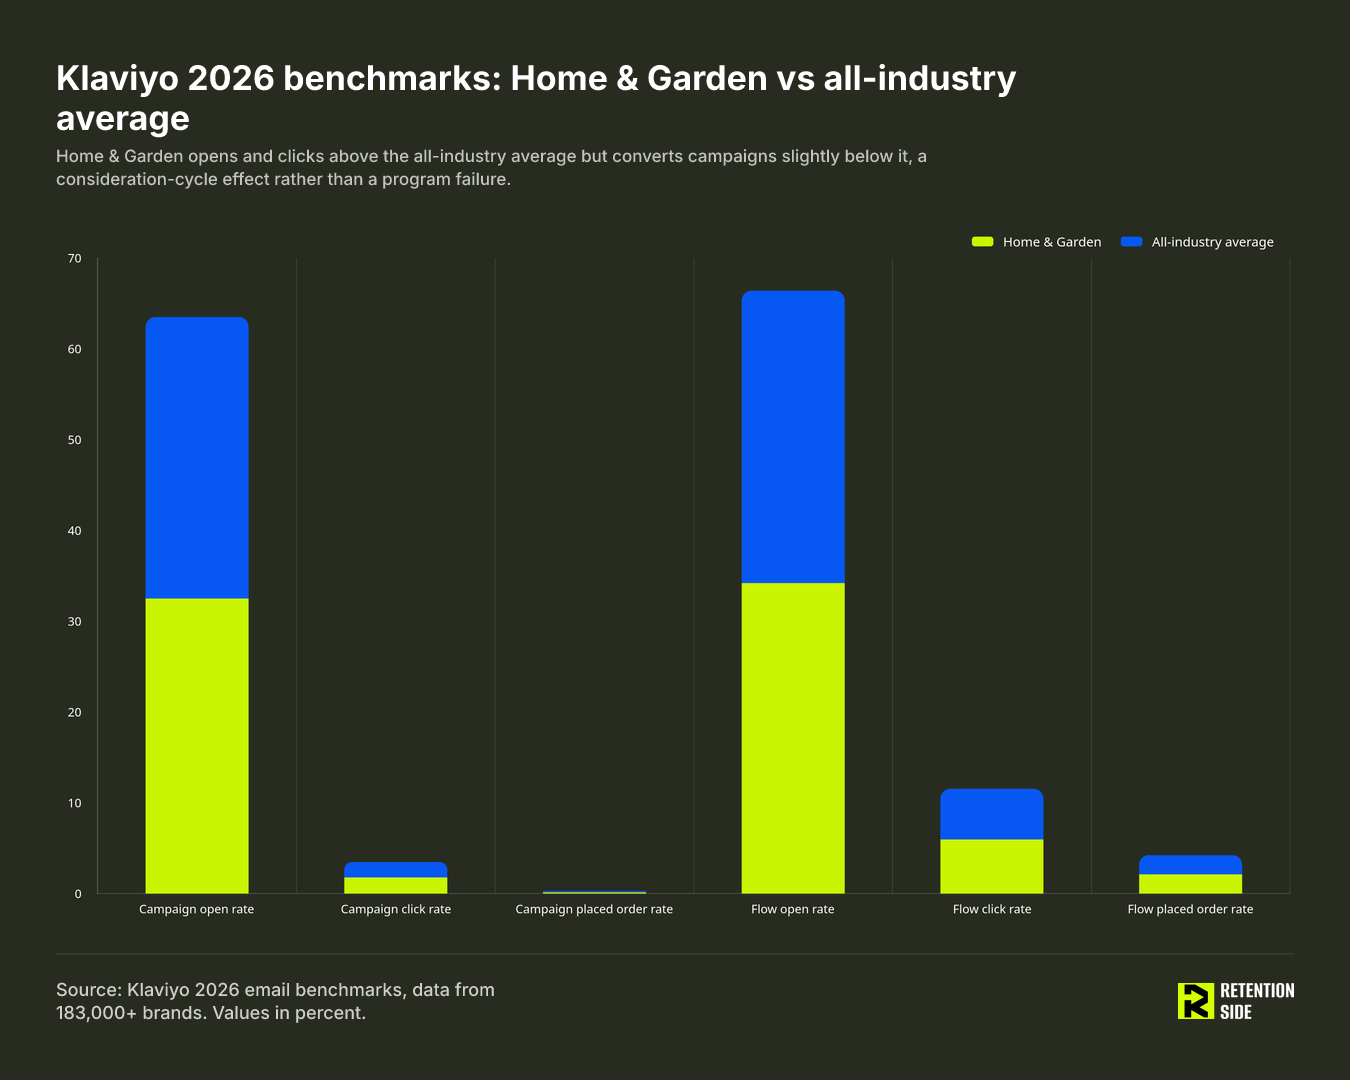
The pattern is consistent and worth sitting with: home decor opens and clicks above the average across nearly every category, but converts campaigns slightly below it. That is not a program failure. That is a consideration cycle showing up in the data. A subscriber opens a decor email because they are actively furnishing a room, browses the click-through, and then goes and measures their wall, checks with a partner, compares three other sites, and comes back to purchase two weeks later, if at all in that session. The engagement is real. The purchase decision just takes longer than a single email cycle can capture.
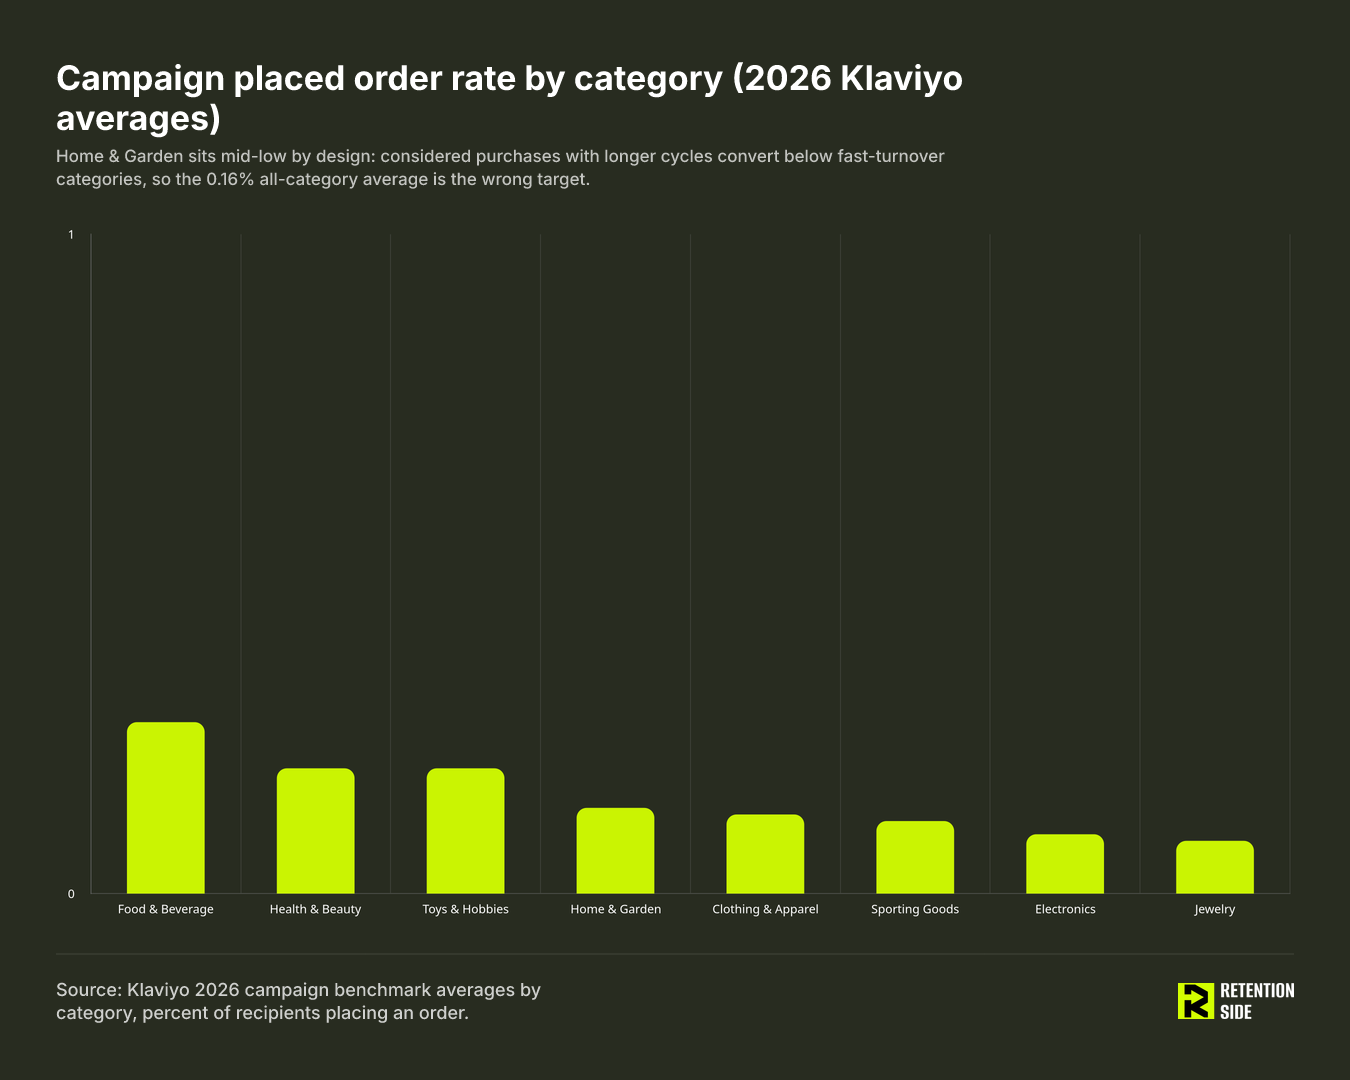
Placed order rate by category tells the same story from a different angle. Food & Beverage leads at 0.26%, followed by Health & Beauty and Toys & Hobbies at 0.19% each, Home & Garden at 0.13%, Clothing & Apparel at 0.12%, Sporting Goods at 0.11%, Electronics at 0.09%, and Jewelry at 0.08%. The categories with the shortest consideration cycles and lowest average order values sit at the top. The categories with the longest consideration cycles and highest order values sit lower. Home decor landing in the middle-low range is exactly where category economics predict it should land, not evidence that the program needs fixing.
The takeaway for anyone benchmarking their own decor brand: if your campaign placed order rate is close to 0.13%, you are performing in line with the category, not underperforming against some abstract 0.16% target that was never built for a furniture or homeware business.
Flow benchmarks home decor brands should actually track
Flows outperform campaigns by a wide margin across every category, and home decor is no exception. Flow placed order rate sits around 2.11-2.12% against a campaign placed order rate of roughly 0.13-0.16%, meaning flows convert somewhere in the range of 13 times better than one-off campaign sends. Flows generated roughly 41% of total email revenue from only about 5.3% of total sends across the Klaviyo dataset. If your flow coverage is thin, that is where the revenue gap is hiding, not in your campaign calendar.
For home decor specifically, a handful of flow benchmarks matter more than the others:
- Abandoned cart: 3.33% placed order rate on average, with top performers reaching 7.69%, and a 6.25% click rate. Cart abandonment is especially common in decor because shoppers are frequently comparing dimensions, finishes, or price across multiple tabs before committing.
- Browse abandonment: 0.95% placed order rate. Lower than cart abandonment by design, since browse-stage intent is weaker, but still meaningfully better than a cold campaign.
- Welcome flow: 2.32% placed order rate with a click-to-conversion rate around 58%, meaning more than half of the people who click through a welcome email end up converting somewhere in that flow’s window.
- Back-in-stock: 6.72% conversion rate and $9.14 revenue per email. This is the single highest-converting flow benchmark relevant to home decor, and it is also the most underused. Decor catalogs restock constantly, popular finishes sell out, seasonal collections cycle back, and a well-built back-in-stock flow captures demand that a brand already earned once.
- Post-purchase: 0.54% placed order rate. This number looks low on its own, but post-purchase flows are not primarily built to sell again immediately. They set up the next purchase cycle, which for decor can be months away, so judging this flow purely on immediate conversion understates its role.
The practical move for a decor brand is to build flow logic around the way people actually shop this category: by room, by style, and by project stage. Someone who just bought a dining table is a strong candidate for a rug or lighting cross-sell weeks later, not a repeat of the same product category tomorrow.

Repeat purchase rate in home decor: the window changes everything
This is the metric most likely to be misread across the entire category, because two credible sources will report wildly different numbers depending on the measurement window, and almost nobody states which window they used.
On a 90-day window, home goods repeat purchase rate averages 15-25%, with top performers reaching roughly 25% when cross-sell is strong. On a 365-day window, furniture repeat purchase rates sit at 10-20%, with Eightx’s 2026 research explicitly noting that “a 15% repeat rate in furniture is normal, not broken.” Neither number is more correct than the other. They are answering different questions. A 90-day window tells you how often customers return within a quarter. A 365-day window tells you how often they return within a year, which matters more for a category where the natural interpurchase interval runs 270 to 365-plus days.
That interval has a direct operational implication: win-back flows should fire at roughly 1.2 to 1.5 times the median interpurchase interval, not on a generic 60- or 90-day cadence borrowed from a fashion or beauty playbook. Fire a win-back too early in home decor and you are messaging someone who simply has not needed to buy again yet.
It is also worth naming the ceiling versus the average distinction. Wayfair reported that 79.1% of its Q4 2025 orders went to repeat buyers, a figure that gets cited as if it represents typical decor performance. It does not. That number reflects a marketplace with enormous product breadth and purchase frequency advantages that a single-brand decor business does not have. Treat it as a ceiling that describes what is structurally possible at massive scale, not a target for your own brand.
The deliverability floor
None of the numbers above mean anything if your emails are not reaching the inbox. Delivery and deliverability are not the same thing: delivery means the message was technically accepted by the receiving server, deliverability means it actually landed somewhere useful, meaning the inbox, rather than spam or a promotions tab nobody checks.
A healthy program keeps inbox placement at 85% or higher. Below 80% is a warning sign. Below 70% is an active problem that will suppress every other metric in this article, because a stalled open rate at that point is not a subject-line problem, it is a deliverability problem wearing a subject-line costume. Spam complaint rate should stay under 0.3% at the outer edge for Gmail, and sustained complaints above 0.1% deserve investigation before you touch anything else. Hard bounce rate should stay under 2%. Proper SPF, DKIM, and DMARC authentication along with one-click unsubscribe are baseline requirements at this point, not optional extras.
This matters more for home decor than people assume, because TargetBay’s analysis of over 20,000 home decor emails found a 16% spam placement rate in Q2 2025, with 81.22% of emails landing in the promotions tab. If a meaningful share of your sends are landing in spam or getting buried in promotions, your open and click numbers are measuring a shrinking pool of people who happen to check that tab, not your actual audience.
How to diagnose your numbers without optimizing the wrong thing
When a home decor brand’s email performance drops, the instinct is usually to rewrite subject lines or launch a bigger discount. That is almost always the wrong first move, because campaign creative sits at the bottom of a diagnostic sequence, not the top.
The order that actually works: deliverability first, because if emails are not reaching the inbox nothing downstream can be trusted. Then list health and growth quality, because a list full of disengaged or low-intent subscribers will suppress every metric regardless of how good the emails are. A lead-to-customer rate of 6-10% within 30 days is a healthy benchmark for intent-targeted pop-ups; anything below 3% means the traffic source or the incentive needs review before you touch the emails themselves. Then flow coverage and trigger reliability, confirming that welcome, cart, browse, post-purchase, and win-back flows are actually firing the way they should. Only after those three layers are confirmed healthy does it make sense to look at campaign strategy, segmentation, and creative or offer quality.
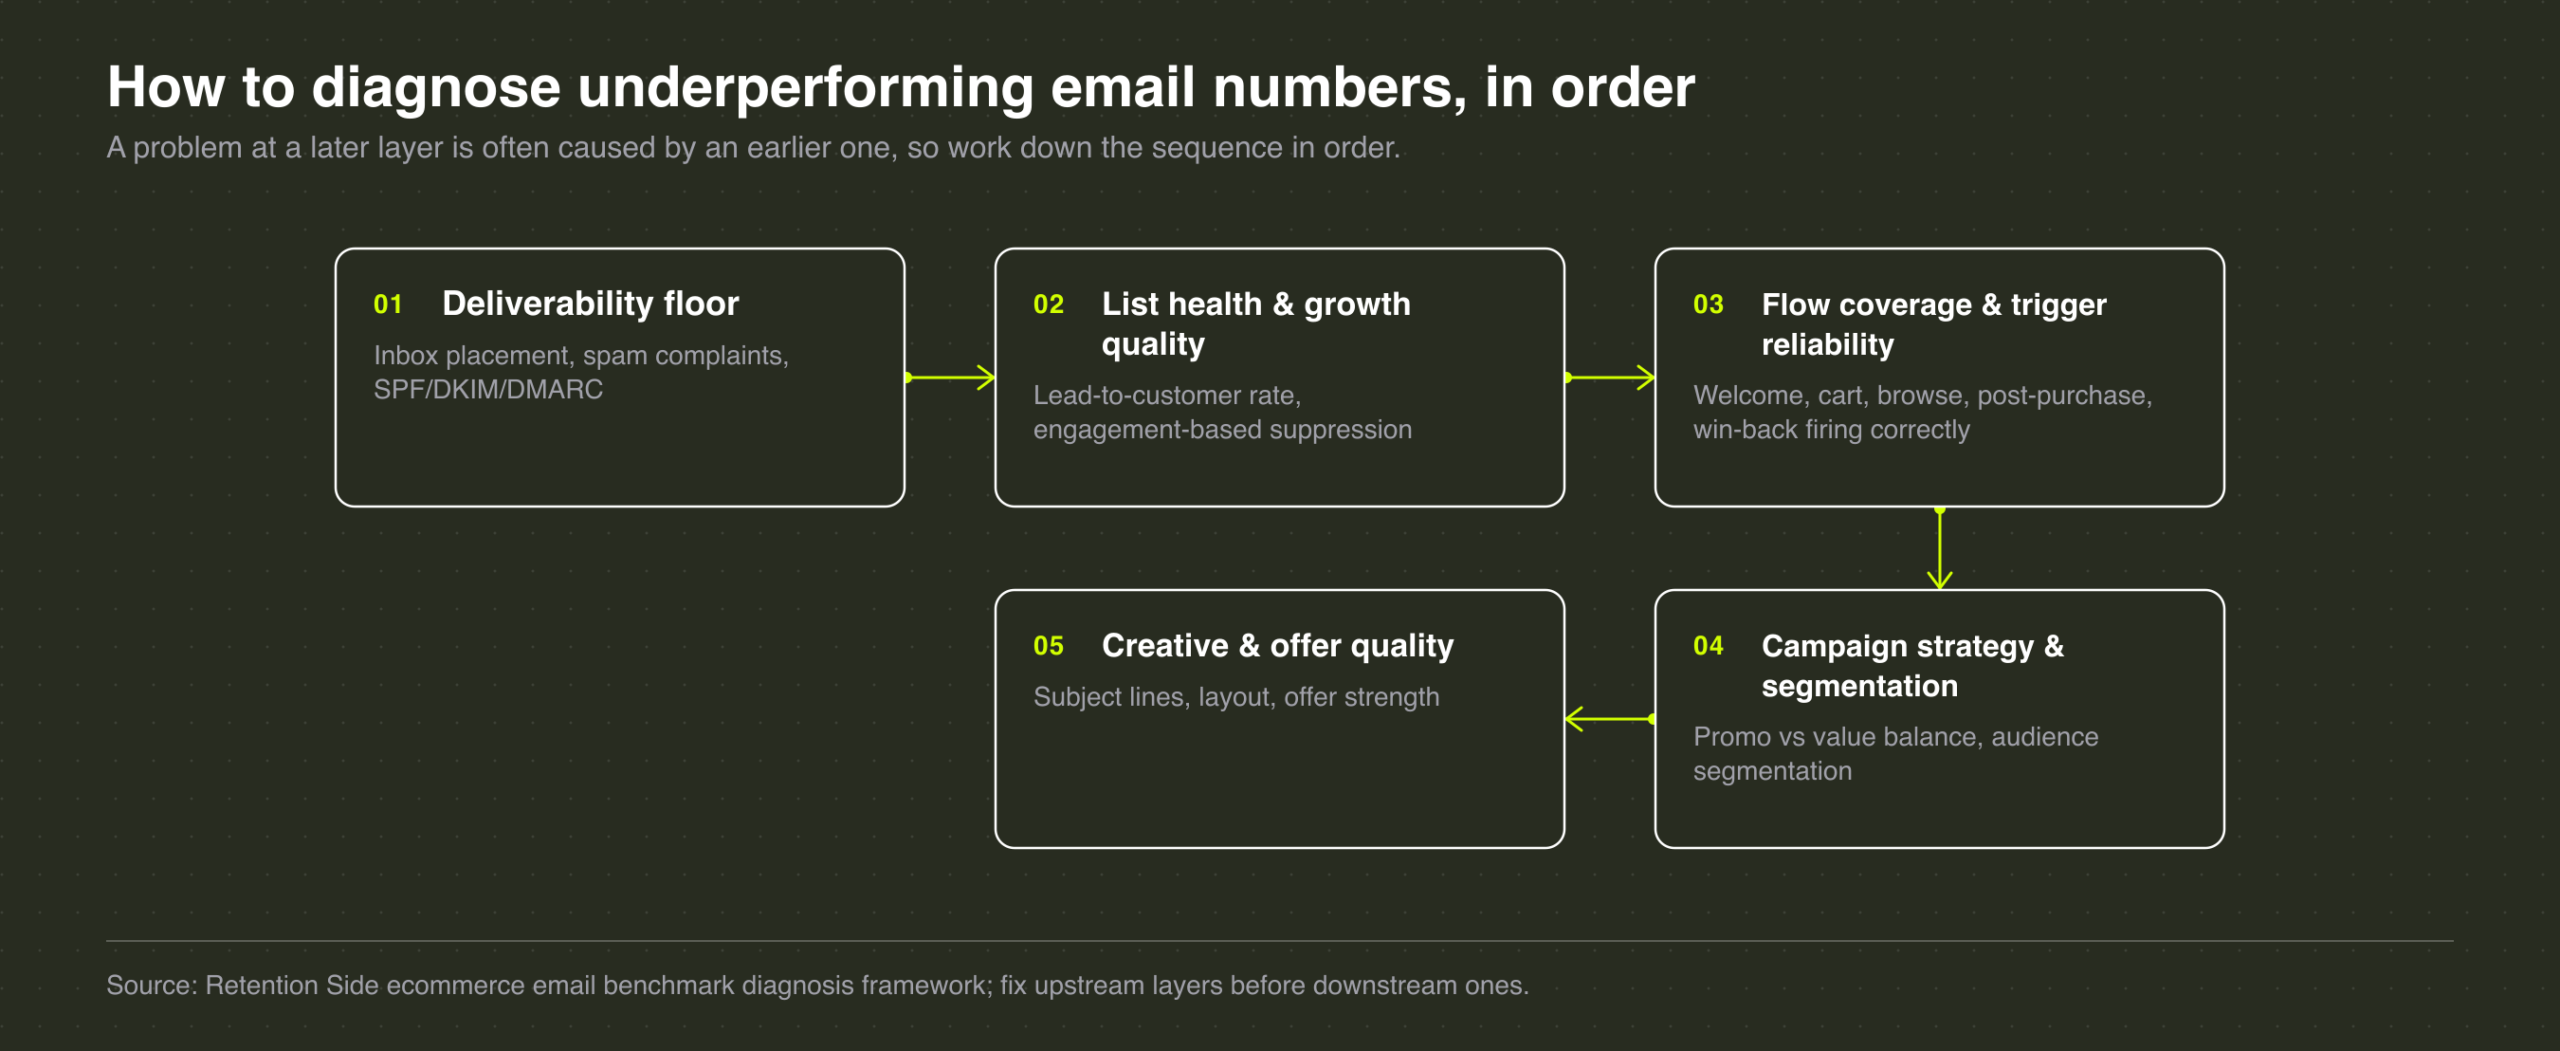
This sequence matters because a problem at a later layer is frequently caused by an earlier one. A “weak campaign” is often a deliverability problem. A “weak flow” is often a list health problem. Skipping straight to creative fixes treats the symptom and leaves the actual cause untouched.
One creative-layer issue worth calling out directly for this category: TargetBay’s research found discount emails are the single most common email type sent by home decor and furnishing brands. That reliance creates a slow-moving problem. If subscribers only hear from a brand during a sale, full-price purchasing erodes over time and engagement becomes conditional on a markdown. Home decor email marketing benchmarks improve fastest when brands rebalance toward value-driven and educational content, style guides, room inspiration, care and maintenance tips, alongside promotions, rather than defaulting to discount-first campaigns.
The 80/20 rule in email marketing
Roughly 20% of an email list generates the large majority of email-driven revenue. This is not a hard mathematical law, it is a consistent pattern that shows up across ecommerce email programs, and it holds especially true in home decor because of the category’s low purchase frequency.
That top 20% is usually made up of three overlapping groups: repeat buyers who have already completed at least one purchase cycle, recent purchasers who are still in an active project or furnishing phase, and highly engaged subscribers who open and click consistently without needing a discount to act. In a category where a large share of the list will only ever make one purchase, identifying and protecting that top 20% through segmentation, VIP treatment, or early access matters more than chasing broad list growth. Sending the same generic discount blast to your most engaged repeat buyers and your coldest never-purchased leads wastes the value sitting in that top segment.
What good metrics look like for home decor brands
Pulled together, the scorecard for a home decor email program looks like this: campaign placed order rate in the 0.10-0.16% range depending on catalog and price point, flow placed order rate above 2%, back-in-stock conversion in the mid-single digits if you run restock cycles, repeat purchase rate evaluated on a 365-day window given the category’s natural buying cycle, lead-to-customer rate of 6-10% for new signups, and inbox placement holding at 85% or higher as the baseline that makes every other number trustworthy.
None of these figures are useful in isolation. A brand can have a strong flow placed order rate and still be leaking revenue through poor deliverability, or a healthy open rate that is really an Apple Mail Privacy Protection artifact rather than real engagement. Benchmarks tell you where to look. They do not tell you what is actually wrong. That is a diagnostic exercise, and it is the same one we run for every home and kitchen brand we work with: check deliverability, check list health, check whether flows are actually firing at the right moments in a long, room-by-room buying journey, and only then touch campaign strategy and creative. Retention Side builds and diagnoses that full system for established home decor and home goods brands, because reading a benchmark table correctly is only useful if you have a plan for acting on what it tells you.
FAQ
What is the 80/20 rule for email marketing?
The 80/20 rule describes the pattern where roughly 20% of a brand’s email subscribers generate the large majority of email-driven revenue. In home decor, that top 20% is typically made up of repeat buyers, subscribers currently in an active furnishing project, and highly engaged non-discount openers. Because home decor has a naturally low purchase frequency, protecting and segmenting this group matters more than maximizing total list size.
What are email marketing benchmarks?
Email marketing benchmarks are reference averages or medians, usually pulled from large aggregated datasets, for metrics like open rate, click rate, placed order rate, and repeat purchase rate. They help you judge whether your own numbers are typical, ahead, or behind comparable brands, but only when you compare against a dataset that matches your category, measurement window, and email service provider methodology. Comparing your home decor numbers against an all-industry average, or mixing a 90-day repeat purchase figure with a 365-day one, produces conclusions that do not hold up.
What are the 2026 email marketing benchmarks by industry?
Using Klaviyo’s 2026 dataset of over 183,000 brands, campaign placed order rate by category runs: Food & Beverage 0.26%, Health & Beauty 0.19%, Toys & Hobbies 0.19%, Home & Garden 0.13%, Clothing & Apparel 0.12%, Sporting Goods 0.11%, Electronics 0.09%, and Jewelry 0.08%, against an all-industry average of 0.16%. Home & Garden campaign open rate sits at 32.5% and click rate at 1.78%, both above the all-industry averages of 31% and 1.69% respectively, while flow placed order rate for Home & Garden sits at 2.12%, essentially in line with the all-industry flow average of 2.11%.
What are good metrics for email marketing?
For a home decor brand specifically, the metrics worth tracking are campaign placed order rate around 0.13%, flow placed order rate above 2%, repeat purchase rate evaluated on a 365-day window given the category’s long consideration cycle, lead-to-customer rate of 6-10% for new subscribers, and inbox placement at 85% or higher. Open rate alone is not a reliable metric anymore due to Apple Mail Privacy Protection inflation, and it should always be read alongside click rate and placed order rate rather than on its own.
The bottom line
Benchmarks are a starting point for asking better questions about your own program, not a scoreboard to chase. Home decor’s numbers look different from other categories because the buying behavior is genuinely different: longer consideration, lower frequency, higher order value. Read your metrics against that reality, fix the diagnostic layers in order starting with deliverability, and the benchmark comparison stops being a source of anxiety and starts being a useful tool for knowing exactly where your system needs work.