


Most ecommerce brands treat email revenue share as a vanity number. It shows up in a monthly report, someone nods, and the conversation moves to acquisition. That’s a mistake. The percentage of total store revenue coming from email is one of the clearest signals of whether your retention system is actually working, or whether you’re running a channel that sends messages without building an asset.
Here’s the range worth paying attention to: most brands sit at 15% to 20% of total revenue from email. Mature programs land at 27% to 33%, and the best-run accounts push past 40% in strong months. That’s not a marginal difference. On a $2M/month store, the gap between 18% and 30% is roughly $240,000 in monthly revenue that either exists inside your owned channel or doesn’t exist at all. The gap isn’t about creative talent or subject line cleverness. It’s structural, and it’s fixable once you know which structure to fix.
Where the 30% benchmark actually comes from
Before getting into tactics, it helps to know that 30%+ isn’t an arbitrary target. It shows up consistently across independent data sets, even though the exact number moves depending on how each source measures attribution.
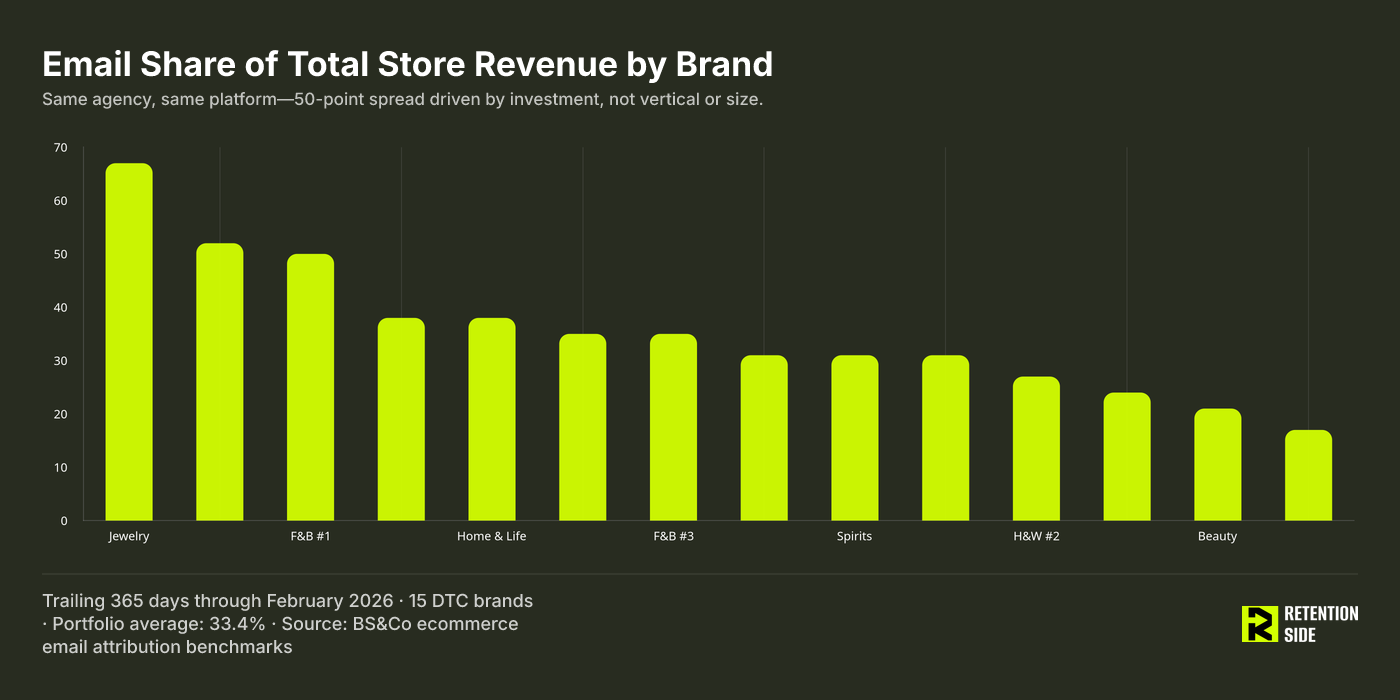
Klaviyo’s historic benchmark analysis found that email drives roughly 27% of total ecommerce store revenue on average, with larger stores above $10M in annual revenue pushing closer to a third of total revenue through email. Separate portfolio data from BS&Co’s ecommerce email attribution benchmarks puts the average even higher: 33.4% of total revenue across $35.3M in combined store revenue from 15 DTC brands, with individual brands ranging from 17% up to 67%. Attrifast’s attribution guide lands in the same neighborhood, reporting a median of 28% of total ecommerce revenue coming from email among Klaviyo customers.
The detail that matters most in that BS&Co data isn’t the average, it’s the range. A jewelry brand at 67% and a beauty brand at 21% aren’t separated by category economics or purchase frequency. They’re separated by investment in the channel. Same platform, same general playbook, 50-point spread. That’s the single most useful fact in this entire body of research: vertical and size do not set your ceiling. Investment does.
Not every brand should chase 30% as a fixed number. A subscription business with high repeat frequency will naturally lean on email differently than a low-frequency, high-AOV furniture brand. But if you’re sitting at 15% and you’ve been there for two years without movement, that’s not a category constraint. That’s an unbuilt system.
What you’ll find in this breakdown
This article walks through the four structural pillars that separate brands stuck under 20% from brands operating at 30%+: deliverability, list growth quality, flow architecture, and campaign discipline. It also covers how the 80/20 customer concentration principle should shape where you spend flow and segmentation effort, and why revenue per recipient is a diagnostic number rather than a target to optimize toward. The FAQ section at the end answers the specific list-value and rule-of-thumb questions operators ask most often.
Deliverability is the revenue floor, not a line item
Every pillar below assumes your emails are actually reaching inboxes. If they’re not, none of the rest matters. This is the part of email marketing that gets the least attention relative to its impact, mostly because it’s invisible until it isn’t. A brand can have flawless flow logic and sharp segmentation and still stall at 12% email revenue share because half its sends are landing in spam or the promotions tab instead of the primary inbox.
Delivery and deliverability get treated as the same thing, and they aren’t. Delivery means the receiving server accepted the message. Deliverability means it landed somewhere the recipient will actually see and act on it. A brand can have a 99% delivery rate and a genuinely poor deliverability rate if half those “delivered” emails are sitting in spam folders nobody checks. If you’re not tracking inbox placement separately from delivery, you’re flying with an instrument that reads the wrong thing.
The 60/40 rule, and why it’s mostly outdated
Operators still ask about the 60/40 rule because it circulates as an SEO talking point, but it actually refers to two unrelated concepts, and only one still matters.
The first version is a content-balance guideline: roughly 60% of your sends should be value-driven or educational, and 40% promotional. This is less a hard rule than a sanity check against list fatigue. If every email is a discount push, engagement erodes and full-price purchasing declines over time, which drags your whole revenue-share number down, not just campaign performance.
The second version is a legacy deliverability heuristic from the early 2000s: emails should be roughly 60% text and 40% images, because early spam filters like SpamAssassin flagged image-heavy emails as likely spam. That standard has lost most of its teeth. Google and Microsoft now filter primarily on engagement signals, meaning opens, clicks, replies, and spam complaints, not text-to-image ratio. The one place it still has a practical edge is Outlook in B2B environments, where images are often blocked by default, so having enough live text ensures the message still makes sense with images stripped out. For most DTC ecommerce sending to consumer inboxes, chasing a strict text-to-image ratio is solving a 2008 problem. Chasing engagement rate solves the 2026 one.
The practical target: inbox placement rate at or above 85%, sender reputation monitored continuously, and list hygiene treated as ongoing maintenance rather than an annual cleanup. Brands that ignore this and keep mailing cold, disengaged segments train inbox providers to distrust their domain, which suppresses deliverability for their entire list, including the good subscribers.
List growth that produces buyers, not vanity counts
The second pillar is list growth, and the mistake most brands make here is optimizing for the wrong number. Form submission rate feels good to report. It isn’t the metric that determines whether your email revenue share grows. Lead-to-customer rate is the metric, because it tells you whether the people your forms are capturing actually convert into paying customers, rather than just inflating a subscriber count that dilutes your engagement metrics and your sender reputation.
This matters more than most brands realize because subscriber value varies enormously based on acquisition quality. BS&Co’s subscriber value research, covering 834,474 subscribers across 15 DTC brands, found a median subscriber worth $4.40 per year in email-attributed revenue, an aggregate average of $12.78, and a range stretching from $0.39 to $144.96 per subscriber. That’s a 370x spread. The research is explicit about what explains it: average order value, not conversion rate. A brand with a $200 AOV and modest conversion will out-earn a brand with a $30 AOV and excellent conversion, on a per-subscriber basis, almost every time.
The strategic implication is that list growth tactics should be evaluated by the quality of the customer they eventually produce, not the immediate capture rate. A pop-up offering 20% off might spike form submissions while attracting one-time deal-seekers who never buy at full price again. A more qualified capture flow, even with a lower submission rate, can produce a smaller list that’s worth substantially more per subscriber over its lifetime. Incentives need to balance conversion lift against margin protection, because the discount that grows your list fastest is often the same discount that trains new subscribers to wait for markdowns.
Flow architecture is the actual revenue engine
If deliverability is the floor and list growth determines subscriber quality, flows are where the majority of the revenue-share gain actually happens. This is the pillar most underinvested brands are missing, and the data on why is stark.
Klaviyo’s 2026 benchmark analysis across more than 183,000 brands found that flows generate nearly 41% of total email revenue from just 5.3% of total sends, with average revenue per recipient roughly 18 times higher than campaigns. Flows also produce 3x higher click rates (5.58% versus 1.69% for campaigns) and 13x higher placed order rates. Perhaps most telling for growth-stage brands: nearly 48% of flow-driven revenue comes from new buyers, compared to just 16% for campaigns, meaning flows are disproportionately responsible for converting first-time purchasers, not just re-engaging existing ones.
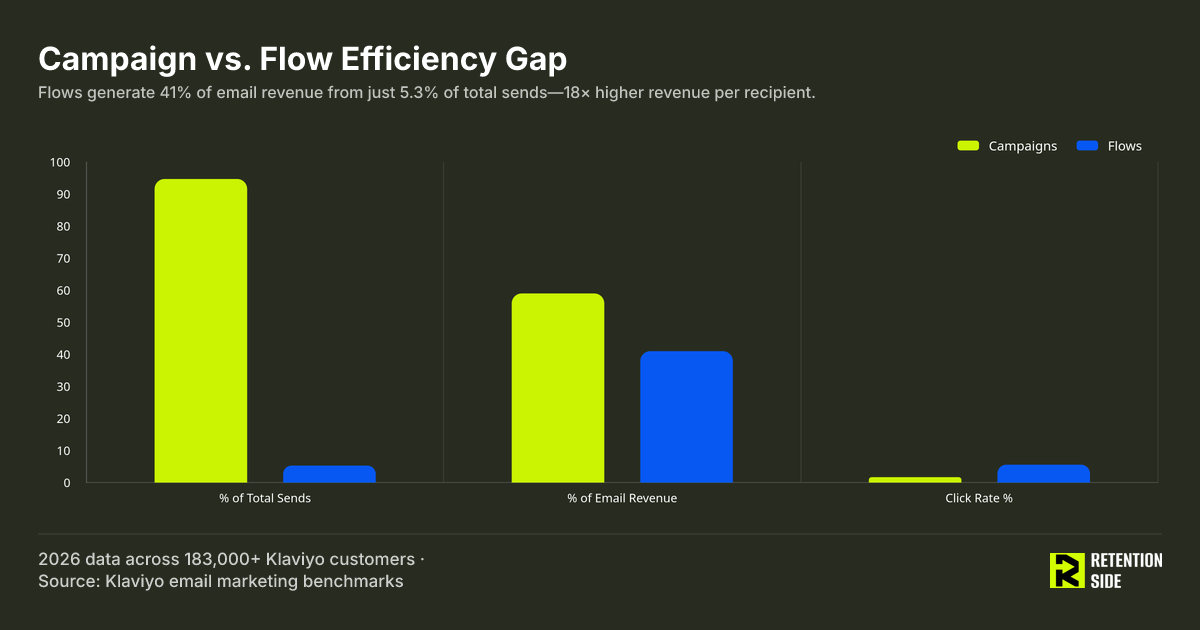
This is where the gap between a 20% brand and a 30%+ brand usually lives. A brand mailing three campaigns a week but running only a bare welcome series and an abandoned cart email is leaving the highest-efficiency part of the channel almost entirely unbuilt. A mature flow architecture typically includes:
- Welcome series for new subscribers, setting expectations and driving first purchase
- Abandoned cart, where the first email alone typically captures 45% to 55% of total flow revenue from that sequence
- Browse abandonment for site visitors who viewed products without adding to cart
- Post-purchase sequences that support the customer after the sale rather than pitching them again immediately
- Cross-sell and upsell flows timed to product usage cycles and replenishment windows
- Winback flows targeting customers who’ve gone quiet before they fully churn
- Sunset flows that clean disengaged subscribers out of active sends to protect deliverability
Not every flow exists to generate direct revenue, and treating them all as sales tools is a common misread. A post-purchase educational flow might exist purely to reduce support tickets and returns. A review-request flow supports social proof rather than immediate conversion. These flows still matter to the overall system, they just get measured differently than a straight revenue-per-recipient number.
Flows are also never a finished project. The brands that keep climbing past 30% are the ones still testing send timing, incentive thresholds, and message sequencing on flows that have technically been “live” for years. A flow built once in year one and never revisited is quietly losing ground every quarter as customer behavior and inbox algorithms shift underneath it.
Campaigns need a purpose beyond the next discount
Flows carry a disproportionate share of revenue, but campaigns still matter, and the split in BS&Co’s data (roughly 51% of email revenue from campaigns versus 49% from flows across their portfolio) shows campaigns aren’t optional even in high-performing accounts. The issue isn’t whether to run campaigns. It’s what those campaigns are for.
A brand that only emails when there’s a sale trains its list to wait for one. That’s the practical consequence of ignoring the content-balance version of the 60/40 rule discussed earlier. If subscribers only hear from you during discount events, full-price purchasing declines over time and your engagement rates drop, because you’ve built an audience of deal-triggered buyers instead of brand-loyal customers. The fix isn’t complicated in concept, though it requires actual planning discipline: build a campaign calendar that mixes product education, brand storytelling, and customer spotlights alongside promotional sends, rather than defaulting to discount-only messaging whenever revenue dips.
Segmentation is the other lever that separates campaigns that hold the line from campaigns that quietly erode it. A campaign blasted to your full list will always underperform the same campaign sent to a narrow, relevant segment, because relevance drives the engagement signals that inbox providers use to decide where your next email lands. Scaling ecommerce email revenue through campaigns comes from sending fewer, more targeted messages rather than more frequent generic ones.
The 80/20 principle should decide where your effort goes
Once deliverability, list growth, flows, and campaigns are functioning, the next lever isn’t a new tactic, it’s resource allocation. The Pareto principle applies with unusual consistency in ecommerce: roughly 80% of revenue tends to come from around 20% of customers. The exact ratio shifts by brand (sometimes 70/30, sometimes 90/10), but the underlying concentration is real and worth building strategy around rather than dismissing as a cliché.
The practical use of this isn’t philosophical, it’s operational. RFM analysis (recency, frequency, monetary value) lets you identify which segment of your list is actually driving the bulk of your revenue, and that segment deserves disproportionate flow and campaign attention relative to its size. Google’s own research on this, using a Turkish retail case study, found that shifting bidding and targeting strategy toward high-value customer profiles produced a 240% increase in new customers and a 310% increase in customer lifetime value. That’s an acquisition example, but the retention application is the same logic: identifying and reinforcing your highest-value segment is a higher-leverage activity than trying to uniformly lift engagement across your entire list.
For flow prioritization specifically, this means your VIP or high-frequency segment should have differentiated messaging, not just the same automation everyone else gets. For campaign targeting, it means your top 20% shouldn’t be receiving the same broad promotional cadence as your bottom 50%, because what re-engages a lapsed one-time buyer is different from what a repeat customer already loyal to your brand needs to hear.
Revenue per recipient is a diagnostic, not a target
Revenue per recipient (RPR) gets treated as a north-star metric in a lot of ecommerce email reporting, and that’s a mistake worth correcting directly. RPR is useful for planning and comparison. It’s not a proxy for whether your retention system is building long-term customer value, and treating it as the primary KPI leads brands to optimize for the wrong outcomes.
Klaviyo’s own benchmark data shows why context matters so much here. For brands in the $1M to $5M revenue range with an AOV between $44 and $83, median campaign RPR sits around $0.09, with top performers reaching $0.21. For brands with AOV above $291, median RPR jumps to $0.53, with top performers at $1.36. Flow RPR runs far higher across the board, with top 10% performers reaching $7.79. Comparing your RPR against a benchmark that doesn’t match your AOV band tells you nothing useful, and comparing your campaign RPR directly against flow RPR is comparing two fundamentally different mechanics.
CustomersAI’s 2026 analysis of 740 million emails across 619 Klaviyo accounts adds a sharper point: flow-dominant accounts, meaning accounts earning more revenue from flows than campaigns, send 3.7 times fewer emails yet earn 3.75 times more revenue per email and 16% more total revenue than campaign-dominant accounts. The same analysis found brands with click rates above 10% generate 20 times more revenue per email than brands below 2%. Engagement quality, not send volume, is the differentiator.
Retention Side’s position on this, reflected across our own benchmarking work, is to track repeat purchase rate and total revenue share from email as primary indicators, with open rate, click rate, and RPR treated as diagnostic signals that explain why those primary numbers are moving, rather than targets in themselves. A campaign with a high RPR but a shrinking repeat purchase rate isn’t a win. It usually means you’re extracting more from fewer engaged subscribers while the rest of your list quietly disengages.
How the pillars compound from 20% to 30%+
None of these four pillars work in isolation, and that’s the real reason the jump from 20% to 30%+ email revenue share tends to happen faster than brands expect once they actually fix the underlying structure. Better deliverability means more of your flow and campaign sends reach inboxes in the first place. Better list quality means those inbox placements convert at a higher rate because the subscribers behind them are more qualified. A fuller flow architecture captures revenue at every stage of the customer journey instead of just the first purchase. And disciplined, segmented campaigns reinforce the relationship instead of eroding it with constant discounting.
This is also why a sudden dip in email performance shouldn’t automatically trigger a campaign strategy overhaul. If your website conversion rate drops, your acquisition channels shift toward lower-intent traffic, or your product mix changes, your email numbers will move even if nothing about your email program itself changed. Retention doesn’t operate in isolation from the rest of the business, and diagnosing a revenue-share plateau correctly means checking acquisition quality and site conversion before assuming the email system itself is broken.
The brands that consistently sit above 30% aren’t running more campaigns or writing cleverer subject lines than everyone else. They’ve built flow coverage across the full customer journey, they protect deliverability as a continuous discipline rather than a one-time setup, they’ve stopped chasing subscriber count in favor of subscriber quality, and they let RFM data decide where their attention goes. That’s a system, not a series of email sends, and it’s the difference between a channel that happens to generate revenue and one that’s engineered to.
FAQ
How much is a 1000 email list worth?
There’s no single figure, because subscriber value depends heavily on average order value, purchase frequency, and engagement quality rather than list size alone. BS&Co’s research across 834,474 subscribers found a median value of $4.40 per subscriber per year, which would put a 1,000-subscriber list around $4,400 annually at the median, though the aggregate average was higher at $12.78 per subscriber. Other benchmarks vary meaningfully: consumer goods brands in the $10 to $30 per subscriber per year range would value the same list at $10,000 to $30,000 annually, and real-world data from Opensend on a 19,000-subscriber list generating roughly $2.63 per subscriber per month implies a run rate closer to $31,500 per year for 1,000 subscribers. The honest answer is that a 1,000-person list built from qualified, high-AOV buyers can be worth 20 to 30 times more than a 1,000-person list built from discount-seeking, low-AOV traffic. List value questions should always come with an AOV question attached.
What is the 60 40 rule in email?
The 60/40 rule refers to two different concepts that get conflated. The first is a content-balance guideline suggesting roughly 60% of email sends should be value-driven or educational content, with the remaining 40% promotional, as a safeguard against list fatigue and declining full-price purchasing. The second is a legacy deliverability heuristic from the early 2000s recommending emails be roughly 60% text and 40% images, based on early spam filters that flagged image-heavy emails as likely spam. That second version has largely lost relevance because modern inbox providers like Google and Microsoft filter primarily on engagement signals rather than text-to-image ratio, though sufficient live text still matters practically for Outlook environments where images are blocked by default. For most ecommerce brands, the content-balance version is the one worth actively managing.
What is a good revenue per email?
This depends entirely on average order value and whether you’re measuring flows or campaigns, so there’s no universal “good” number. Klaviyo’s benchmark data shows campaign revenue per recipient (RPR) for $1M to $5M revenue brands ranging from around $0.09 at the median (AOV $44 to $83) up to $0.53 at the median for brands with AOV above $291. Flow RPR runs substantially higher across every band, with top 10% performers reaching $7.79. A useful reference point rather than a target: stores in the top 25% of campaign performance typically earn about 2.5 to 3 times the revenue per email of the median. Rather than chasing a fixed RPR figure, compare your own numbers against your specific AOV band and treat RPR as a signal for planning and testing rather than a primary success metric, since it doesn’t reflect whether your retention system is building lasting customer value.
What is the 80 20 rule in ecommerce?
The 80/20 rule, or Pareto principle, holds that roughly 80% of results come from about 20% of causes. Applied to ecommerce, this typically means around 80% of revenue is generated by roughly 20% of customers, though the exact ratio varies by brand and can land closer to 70/30 or 90/10 depending on category and purchase frequency. The strategic value of this principle is in resource allocation: rather than spreading retention effort evenly across your entire customer base, RFM analysis (recency, frequency, monetary value) can identify your highest-value segment so flows, campaigns, and loyalty investment can be weighted toward retaining and replicating those customers. Google’s research on a retailer applying value-based targeting toward high-value customer profiles documented a 240% increase in new customers and a 310% increase in customer lifetime value, illustrating how concentrating effort on the highest-value segment tends to outperform uniform, list-wide strategies.
Where to focus if you’re under 20%
If your brand is stuck below 20% email revenue share, the fix isn’t a new campaign calendar or a rebrand of your welcome series. It’s an honest audit of the four pillars in order: confirm your emails are actually reaching inboxes, confirm your list growth is producing buyers rather than just subscribers, build out flow coverage across the full customer journey rather than just the first purchase, and rebuild your campaign calendar around genuine value instead of constant discounting. The brands sitting at 30%+ didn’t get there with better copywriting. They got there by treating email as infrastructure and giving each of those four pillars the attention it actually requires.