


Most SMS benchmark panic is self-inflicted. A brand pulls a revenue-per-message number from one report, sets it next to its own blended dashboard, sees a gap, and concludes the channel is underperforming. Or the reverse happens: the numbers look fine, nobody digs in, and a weak flow setup goes unnoticed for a year.
In both cases the channel is rarely the problem. The comparison is. Ecommerce SMS marketing benchmarks only help when you line up message type, denominator, percentile and time window first. This guide uses three primary sources, Klaviyo, Postscript and Omnisend, to show how to do that and where each one can mislead you.
Key takeaways
- SMS flows carry a small share of sends and a large share of revenue, so a campaign-heavy program will always look weak per message.
- Earnings per message varies by more than an order of magnitude between message types. A blended average hides that.
- Percentile bands matter. The distance between the 25th and 75th percentile is where the real opportunity sits.
- Platforms define conversion rate and revenue per message differently. Check the denominator before you compare.
- Per-message metrics alone misstate ROI. Judge the program on subscriber value and retention too.
Why flows make campaigns look weak
Start with the biggest structural fact in SMS reporting. In its 2026 SMS marketing benchmarks, based on more than 183,000 Klaviyo customers, Klaviyo reports that SMS flows account for 7.6% of sends but drive 45.2% of total SMS revenue. The page does not state a data window, so treat it as a 2026 release snapshot rather than a dated period.
The rate gaps are just as wide. Klaviyo puts a good SMS click rate at 5.6% for campaigns and 9.65% for flows, and a good conversion rate at 0.27% for campaigns and 1.9% for flows. Flows also generate roughly eight times the revenue per recipient of campaigns on average.
| Klaviyo 2026 metric | Campaigns (average) | Flows (average) | Campaigns (top 10%) | Flows (top 10%) |
|---|---|---|---|---|
| Click rate | 5.6% | 9.65% | 10.44% | 16.6% |
| Conversion (order) rate | 0.27% | 1.9% | 0.61% | 3.92% |
Source: Klaviyo, 2026 SMS marketing benchmarks, based on over 183,000 Klaviyo customers. No explicit data window is stated on the page.
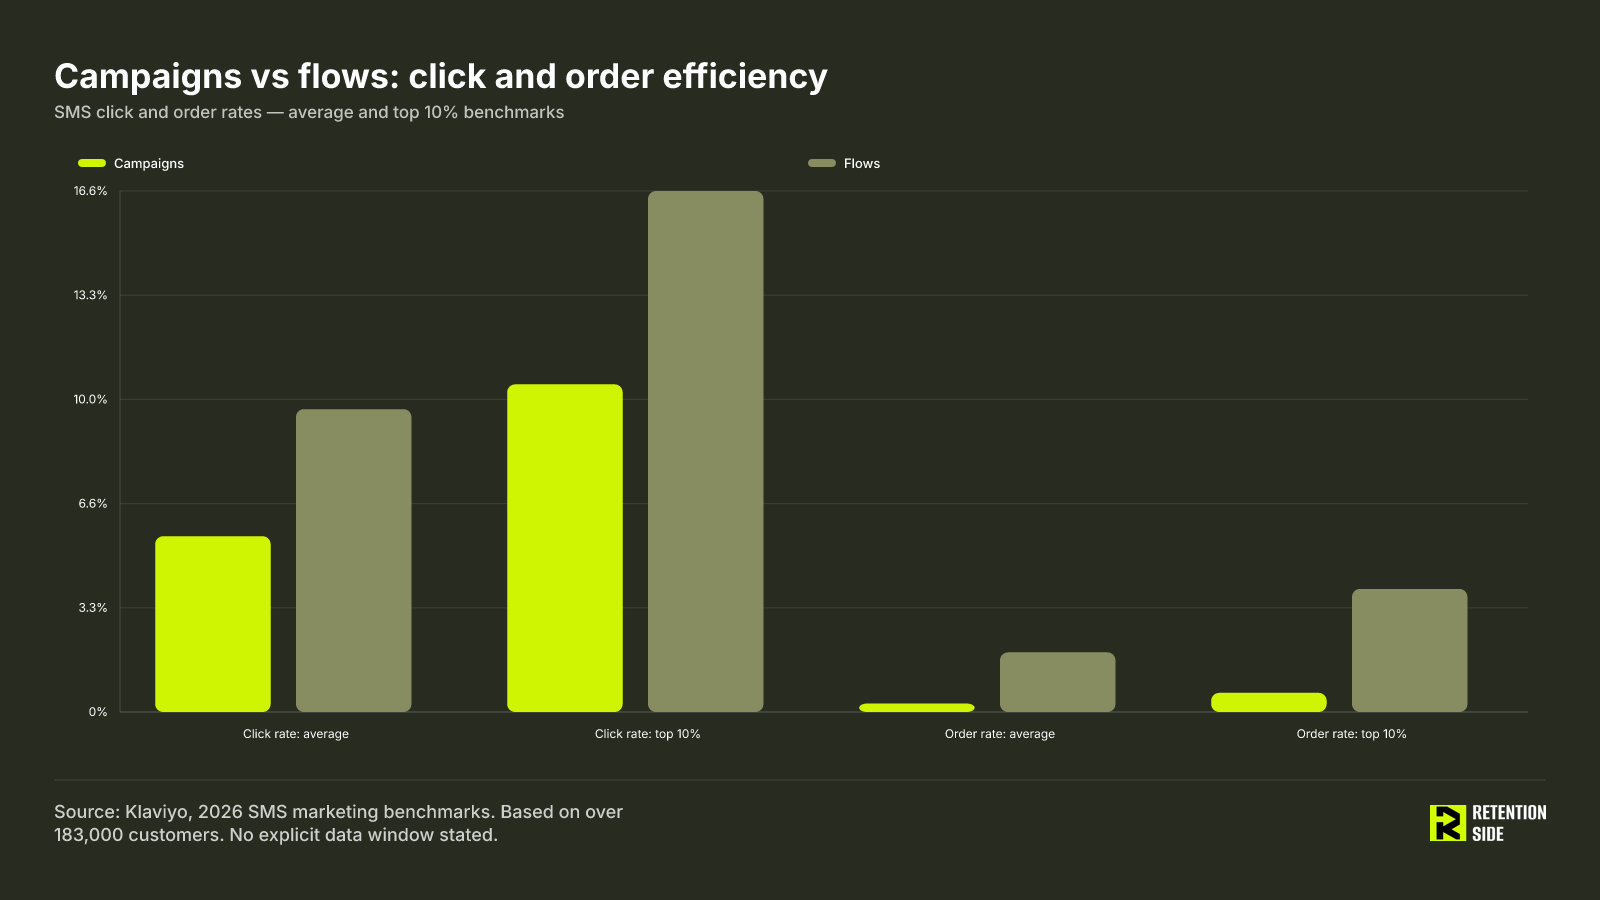
Omnisend sees the same pattern from a different dataset. In its 2025 ecommerce marketing report, covering messages sent by Omnisend merchants in the 2024 calendar year, automated SMS made up 9% of sends but 18% of SMS orders. Click rates for SMS automations ran 147% higher than campaigns, and conversion rates were 118% better. The ratios differ from Klaviyo’s, which is expected. Different merchants, different years, different definitions. The direction does not differ.
Here is the practical read. Flows fire on behavior: an abandoned cart, a welcome, a restock. The customer has already signaled intent. Campaigns go to a segment on your schedule. Flows earn a premium because the timing is earned by the customer, not picked by the marketer. A program that sends mostly campaigns will post a low blended revenue per message and look disappointing, even if the campaigns are well made.
There is one more detail worth keeping. Klaviyo reports that 64.4% of SMS flow revenue comes from new buyers, versus about 20% for campaigns. Flows are doing acquisition-adjacent work, converting first-time purchasers. Campaigns lean on people who already know you. Those are different jobs, and they should not be scored against each other.
Message type decides the benchmark
If flows and campaigns differ this much, the next question is which flows. Postscript’s 2026 SMS Benchmarks, built from aggregated data across more than 17,000 Shopify stores using Postscript, break earnings per message (EPM) out by message type. The measurement period runs from 2025-01-01 to 2025-12-15, and eligible shops had to be installed 90 days before Black Friday (2025-11-28) and have spent at least $100 on Postscript Marketing in Q3 2025.
| Message type | EPM, 25th percentile | EPM, 75th percentile |
|---|---|---|
| Campaign | $0.11 | $0.55 |
| Win back | $0.19 | $0.82 |
| Post purchase | $0.34 | $1.53 |
| Welcome series | $0.58 | $3.05 |
| Browse abandonment | $0.93 | $2.85 |
| Keyword | $1.35 | $15.86 |
| Abandoned cart | $3.52 | $10.95 |
| Back in stock | $5.92 | $13.34 |
| Popup | $8.28 | $23.78 |
Source: Postscript, 2026 SMS Benchmarks, Shopify merchants on Postscript, 2025-01-01 to 2025-12-15. Vendor-reported data.
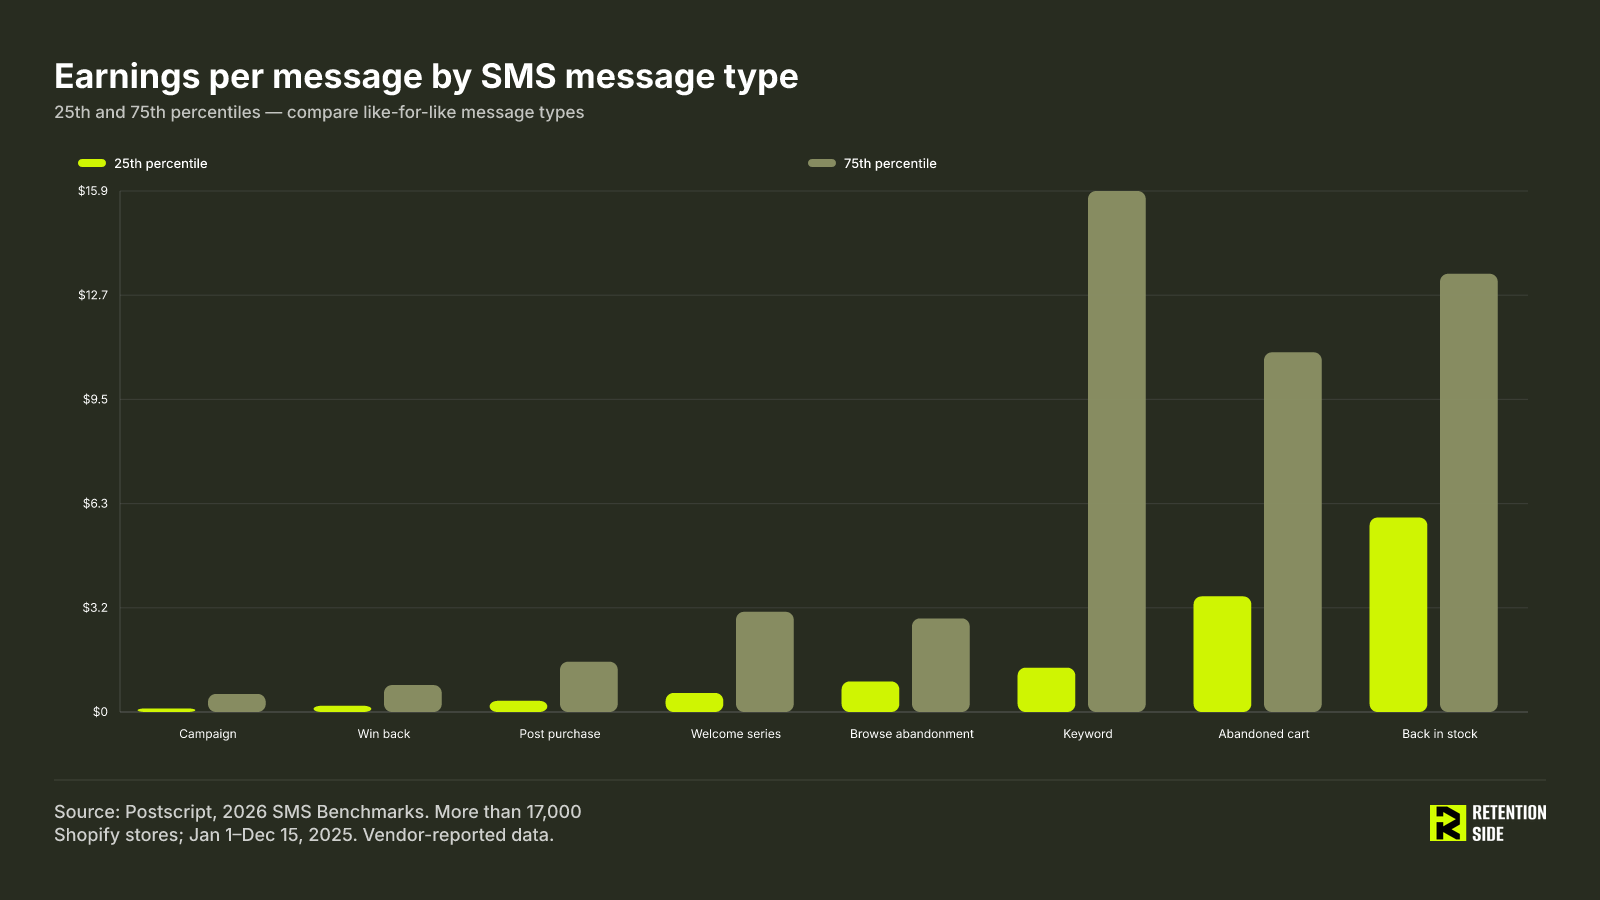
Look at the anchor comparison. A top-quartile campaign earns $0.55 per message. A bottom-quartile abandoned cart flow earns $3.52. Even a bottom-quartile back-in-stock message, at $5.92, beats the 75th percentile of every campaign. That is the clearest illustration that message type, not effort, explains most of the gap between a “good” and a “bad” EPM.
This changes how you should read your own account. If your blended EPM sits at $0.40, that number alone tells you nothing. A program that sends 90% campaigns could be performing well. A program with strong cart and restock flows at the same blended number could be underperforming. Split every metric by message type before you judge it.
Postscript’s own campaign data shows the same ceiling for the broadcast side. Campaign click-through runs from 2.87% at the 25th percentile to 8.01% at the 75th, with conversion rates of 0.12% to 0.54%. Compare that with Klaviyo’s campaign figures above and you will see the numbers are near neighbors but not identical, which is exactly what you would expect from two different merchant bases and definitions.
Percentile bands show where the upside is
A benchmark is a distribution, not a target. The spread between the 25th and 75th percentile in Postscript’s data is large for the messages that matter most. Abandoned cart goes from $3.52 to $10.95, back in stock from $5.92 to $13.34, and keyword messages from $1.35 to $15.86.
That spread is a diagnostic. If your cart flow sits near the 25th percentile, you probably do not have a channel problem. You likely have a trigger timing issue, a weak offer or message, a poor consent or list quality situation, or a site experience that loses people after the click. A three-times gap between quartiles on a single message type is too large to be noise.
Our rule of thumb is to benchmark against the median, aim for the upper quartile. The median tells you whether something is broken. The 75th percentile tells you what is reachable with the same channel, a similar audience and better execution. Chasing the median as a goal builds in mediocrity.
One caution. Percentiles are only meaningful inside a peer group. A 75th percentile figure that includes high-AOV, high-repeat brands is not a fair target for a low-margin consumable brand with a single-product catalog. Use the bands to set direction, then narrow the peer group as far as the data allows.
Industry splits help, but only on the right denominator
Klaviyo publishes average SMS revenue per recipient (RPR) by industry, as campaign and flow pairs. It is a useful sanity check, provided you remember that RPR divides revenue by recipients, not by messages sent.
| Industry | Campaign RPR | Flow RPR |
|---|---|---|
| Automotive | $0.35 | $6.15 |
| Clothing and accessories | $0.32 | $2.31 |
| Electronics | $0.28 | $3.48 |
| Food and beverage | $0.34 | $1.83 |
| Hardware and home improvement | $0.26 | $4.57 |
| Health and beauty | $0.32 | $2.09 |
| Home and garden | $0.32 | $3.74 |
| Jewelry | $0.31 | $2.85 |
| Miscellaneous ecommerce | $0.36 | $2.52 |
| Specialty | $0.31 | $2.21 |
| Sporting goods | $0.34 | $3.30 |
| Toys and hobbies | $0.28 | $2.82 |
Source: Klaviyo, 2026 SMS marketing benchmarks. No explicit data window is stated on the page.
Two things stand out. Campaign RPR barely moves across industries, staying between $0.26 and $0.36, while flow RPR ranges from $1.83 to $6.15. Industry shapes what your automations can earn far more than what your broadcasts can. Also, Klaviyo says the top 10% of SMS flows exceed $5 in RPR, which is above the average for every category listed except automotive.
Do not set Klaviyo’s RPR next to Postscript’s EPM as if they were the same figure. One is revenue per recipient, the other is earnings per message. A subscriber who receives four messages in a flow changes the ratio completely.
Four checks before you compare
Most benchmark misreads come from skipping one of four checks. Run all of them before you decide anything about ROI.
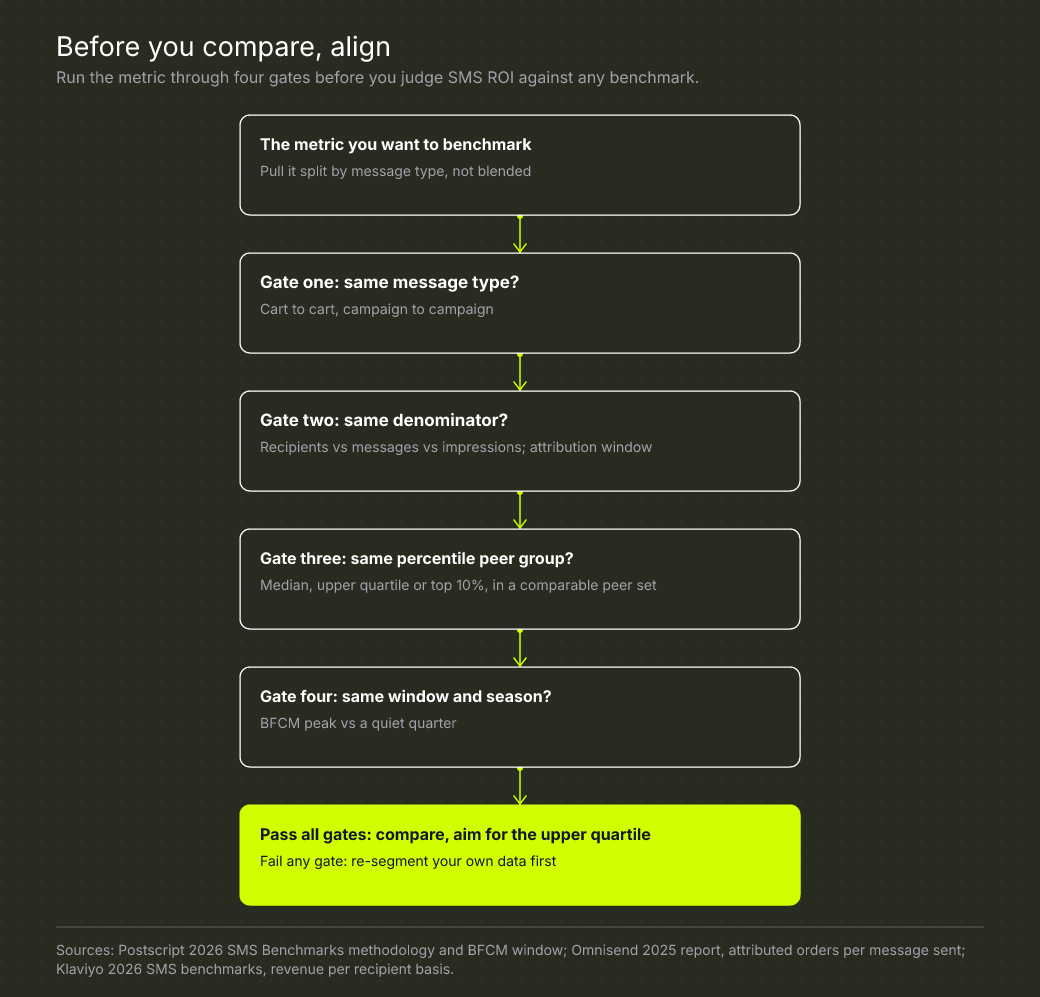
- Same message type? Compare cart to cart, campaign to campaign. Never compare your blended number to a single flow benchmark, or the reverse.
- Same denominator? Omnisend calculates conversion rate as attributed orders over total messages sent, and click rate as clicks over messages sent. Postscript defines popup email and phone conversion rate as conversions divided by total impressions, which its methodology notes “differs from some competitor reporting.” Your platform may use a third definition. Attribution windows add another layer. Klaviyo, for example, connects a purchase to a message through a defined window after a click or open, so the window you use changes the revenue you see.
- Same percentile peer group? Decide whether you are comparing to the median, the upper quartile or the top 10%, and whether the peer group looks like your business. Geography matters too. Omnisend reports a 10.65% SMS campaign click-to-conversion rate in the UK against a 2.18% global average, which shows how far a regional baseline can sit from a global one.
- Same window and season? Postscript separates its Black Friday and Cyber Monday window from the rest of the year, and Omnisend’s data covers calendar 2024. A promotional peak and a quiet quarter should not be set side by side.
If a comparison passes all four, use it. If it fails any, re-segment your own data until it passes, or discard the comparison. A rough benchmark that fails these checks is worse than none, because it feels like evidence.
Program-level metrics matter more than message averages
Per-message metrics tell you how a send performed. They do not tell you whether the SMS program is healthy. Postscript also publishes program-level figures, again for 2025-01-01 to 2025-12-15:
| Metric | 25th | 50th | 75th | 90th |
|---|---|---|---|---|
| Acquisition rate | 0.45 | 1.06 | 2.32 | 5.22 |
| Revenue per message | $0.41 | $0.98 | $2.13 | $4.54 |
| Messages per subscriber | 0.83 | 1.91 | 3.84 | 6.65 |
| Retention rate | 86.35% | 93.13% | 96.95% | 99.08% |
| Subscriber LTV | $25.04 | $71.20 | $205.14 | $553.02 |
Source: Postscript, 2026 SMS Benchmarks, Shopify merchants on Postscript. Vendor-reported data. Confirm Postscript’s definition of each metric before mapping it to your own reporting.
The subscriber LTV spread is the striking one. Moving from the median to the 75th percentile nearly triples value per subscriber. And messages per subscriber climbs alongside it, though the data here does not prove that sending more causes the lift. It does suggest that brands in the top quartile are not simply mailing less.
The takeaway is to pair message-level EPM with subscriber-level value and retention. A program can post a respectable revenue per message while quietly burning through its list with weak frequency control. Omnisend’s finding that brands sent 31% more SMS messages year over year in 2024 is a useful reminder that volume is rising across the market. More messages into the same audience is not automatically more revenue. We would rather judge SMS the way we judge any retention program: by repeat customer rate, retention revenue and time between orders, not by the dashboard metric that looks best this week.
Where SMS fits in the retention system
The benchmark data points to a clear role for SMS. The highest-earning message types in Postscript’s data are abandoned cart, back in stock, keyword and popup. These are moments of stated intent: a person who left a cart, asked to be told when a product returns, or texted a keyword. They are time-sensitive, and SMS is built for time-sensitive. That is why we position SMS around flash sales, shipping updates, restock alerts and loyalty milestones, working alongside email rather than replacing it.
Sequencing matters too. If deliverability is shaky, lifecycle flows are thin and campaigns are not segmented, adding SMS means distributing the same foundational problems across more channels. Fix the email foundation first, then layer SMS on top where the behavior justifies it. If you want the equivalent view for email, our guide to ecommerce email marketing benchmarks covers it, and the email flows vs campaigns explainer applies the same logic to the email side of the program.
When SMS performance does dip, resist the urge to blame the channel. Acquisition quality, site conversion, list consent practices and frequency can all drag a number down. Our approach to SMS marketing starts with response analysis, trigger and timing refinement, and frequency and pacing control for exactly that reason.
FAQ
What is a good SMS conversion rate for ecommerce?
Using Klaviyo’s 2026 benchmarks, a good SMS conversion rate is 0.27% for campaigns and 1.9% for flows on average, with top-10% brands reaching 0.61% and 3.92%. Postscript’s campaign conversion runs from 0.12% to 0.54% between the 25th and 75th percentile. The definitions differ between platforms, so confirm the denominator before you pick a target.
Do SMS flows or campaigns perform better?
Flows, on every rate metric. Klaviyo reports roughly eight times the revenue per recipient for flows, and Omnisend finds click rates 147% higher and conversion rates 118% better for SMS automations. But flows account for only 7.6% of sends in Klaviyo’s data and 9% in Omnisend’s, so a healthy program needs both, doing different jobs: flows on behavior triggers, campaigns on scheduled segments.
Why do SMS benchmarks differ between platforms?
Different merchant bases, different years and different definitions. Postscript defines popup conversion rate as conversions divided by total impressions, which its methodology notes “differs from some competitor reporting,” while Omnisend calculates conversion as attributed orders over total messages sent. Attribution windows differ as well, which changes the revenue each platform attributes to a message.
The takeaway
Benchmarks are a starting point for diagnosis, not a verdict on ROI. Split by message type, confirm the denominator, pick the right peer group and respect the time window, and the numbers become useful.
Then look at the spread. The distance between where your flows sit and the upper quartile is usually a clearer to-do list than any single benchmark figure.